Learn in this Webinar
In this IOT data analytics webinar Bart Adams, CTO & Founder of xyzt.ai, a location intelligence platform, explains together with Nick De Beer, Head of Global BD at xyzt.ai , how to streamline your data and put it to work to unlock its full potential and launch new revenue streams.
- How to go to market faster by using a powerful visual analytics tool for your IoT data.
No need to build and maintain your own visual analytics solution.
This is how you save time and budget ! - Strategies to finally monetize your IOT data and bring new analytics services and products to the market. For example, how to enrich your own IoT data by adding third party data, and simply share data analytics reports or dashboards with your customers.
Use case 1: Crowd Monitoring
Integrating crowd monitoring sensors to provide visual dashboards for cities and event organizers
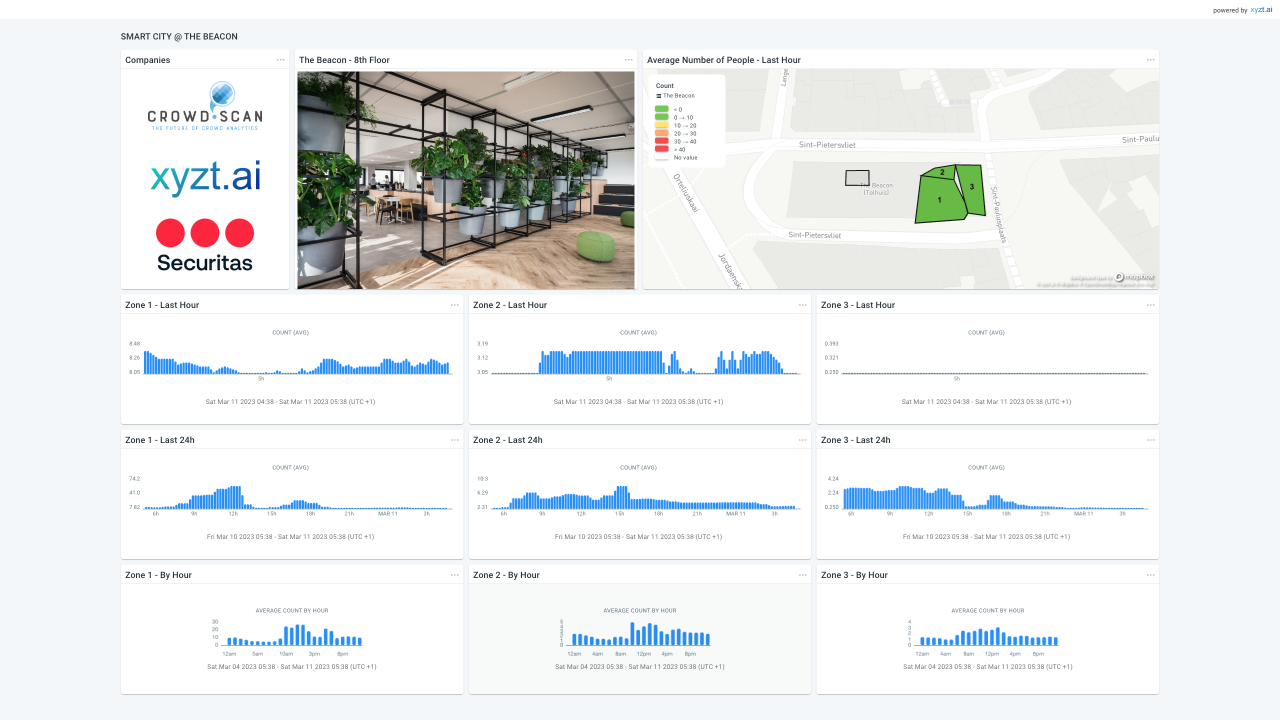
Crowdscan is an innovative IOT company specialized in accurate real-time privacy preserving crowd monitoring.
Learn how Crowdscan leverages the xyzt.ai platform:
- To connect the output of their sensors to the xyzt.ai platform
- To build informative dashboards that are easy to monitor by city analysts or event organizers
- To provide historic analytical capabilities to analyze trends, patterns, and anomalies in the people flow
Working with xyzt.ai is such a win-win. We capture real-time series data with our sensors and by using the xyzt.ai analytics tool, we can make the data intuitive for our customers to understand. We can spatially visualize the data, learn about the different segmentations, and we can create data dashboards to combine it with our own. This combination of having a go-to tool that we can use internally as well as externally to show our data to customers is very important for us.
Ben Bellekens, CEO CrowdScan
Register here to watch the webinar
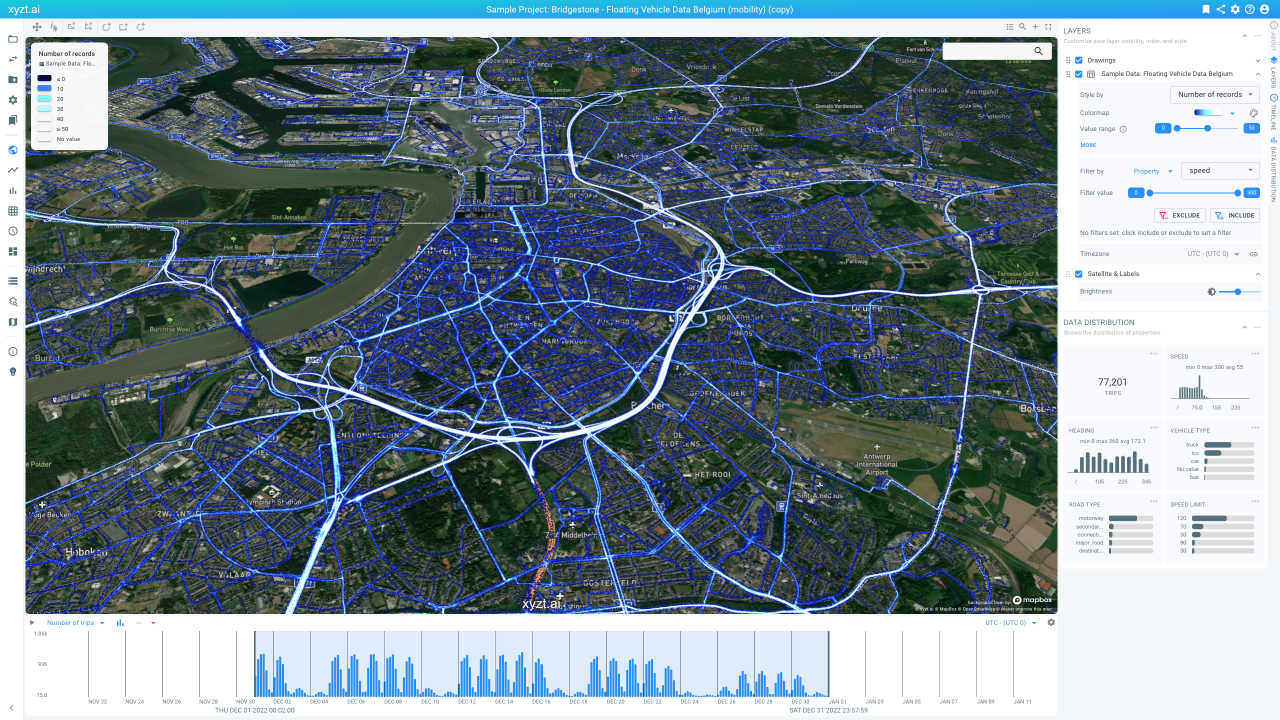
Use case 2 : Exploiting Connected Vehicle Data
Using connected vehicle data as the fuel to provide road safety, traffic efficiency, and road condition insights
Connected vehicle data is an exciting IOT data source generated by cars, vans, and trucks. The data consists of information about the location, speed, but also about sensors on the cars such as vertical acceleration.
Many xyzt.ai users leverage the xyzt.ai platform to provide easy visual views and analytics on top of this data.
In this case study you will learn how to:
- Build a data pipeline that ingests connected vehicle data on a daily basis
- Provide access to your customers to the xyzt.ai platform for easy analysis
- Embed components in your own application
Register here to watch the webinar
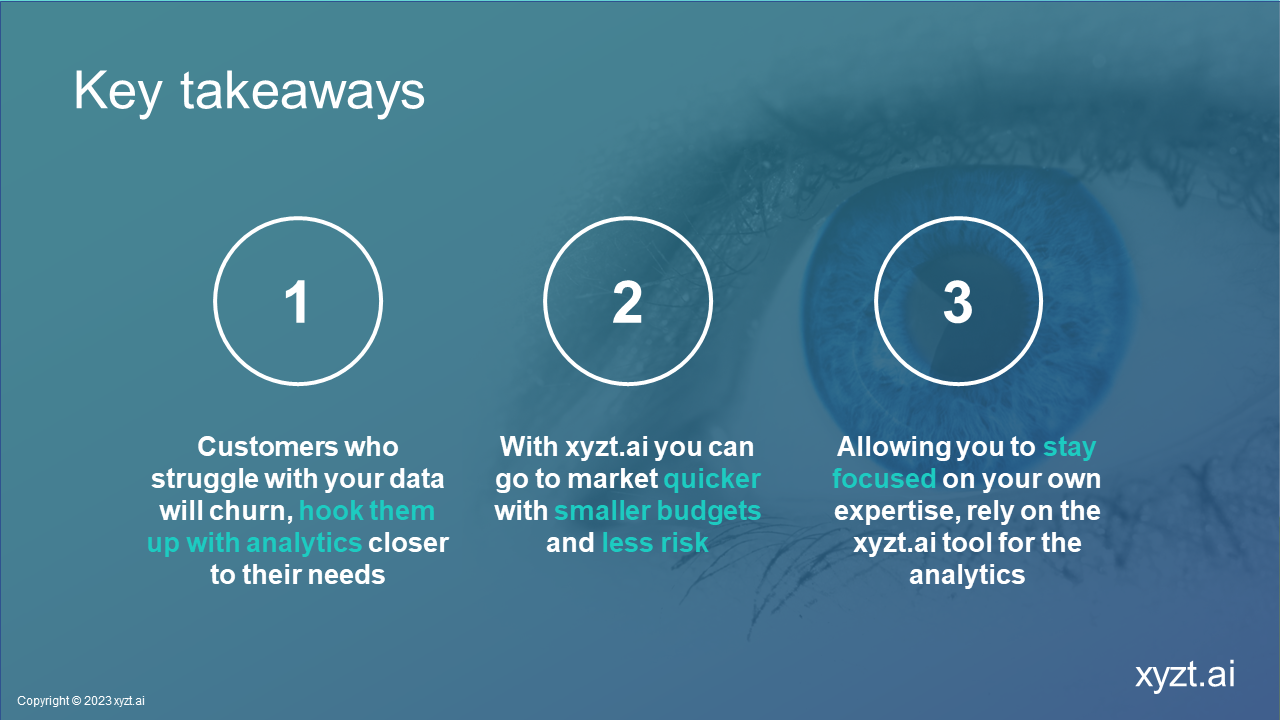
Key Take-Aways
Register here to watch the webinar
Free Trial
If you would like to visualize and analyze trips data for yourself, sign-up for a free trial of the xyzt.ai platform, where you’ll find a mobility data set from INRIX.
FREE TRIAL – SIGN UP NOW
Sign up to our free trial to see IOT data in action. The trial provides examples with floating vehicle data, air quality data, vessel tracking data, aircraft tracking data, and more.
Contact us
If you have any other questions, or if need help with your data visualization and analysis needs, please contact us.