What is Floating Vehicle data?
Sign up to watch the webinar and find out more.
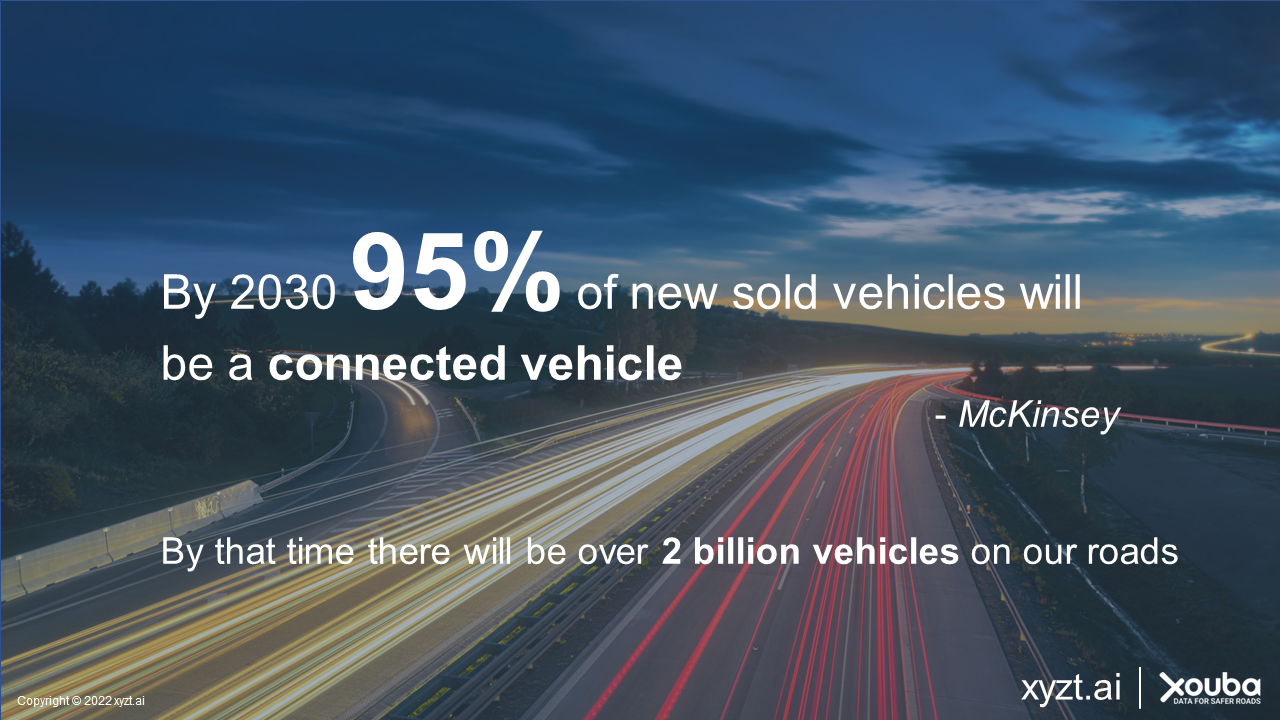
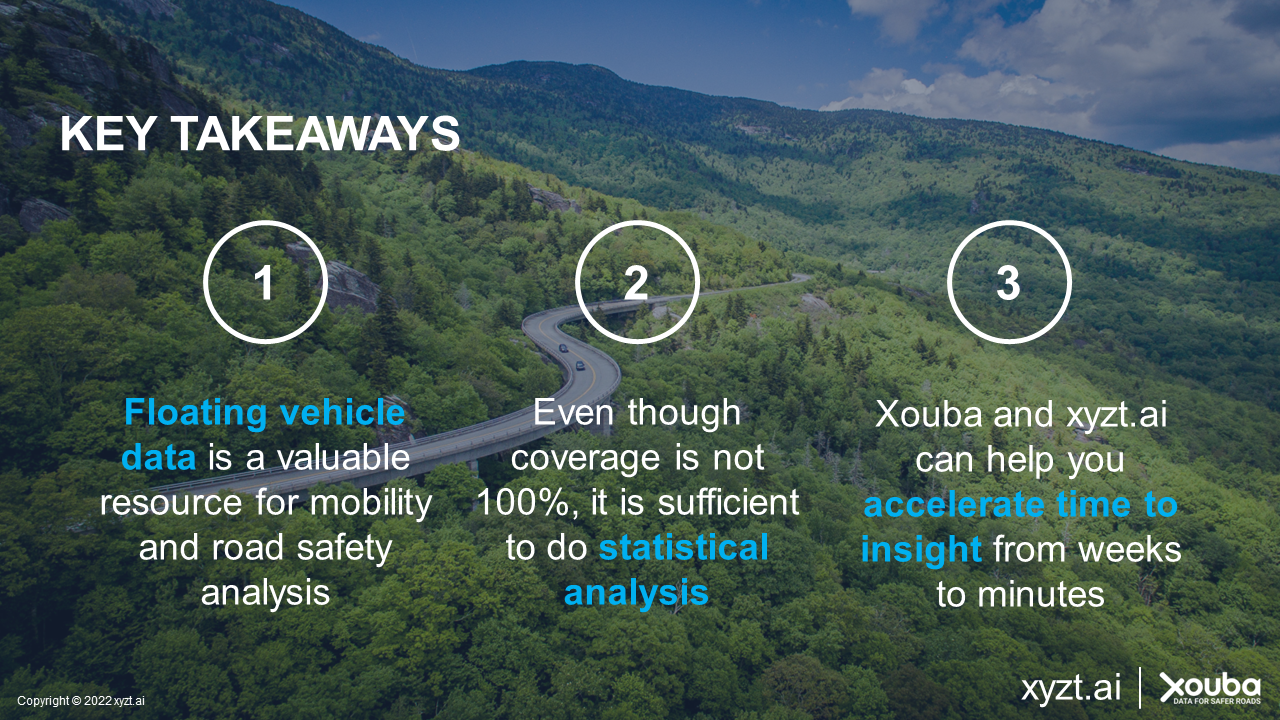
Floating vehicle data is the collection of data records obtained from connected vehicles.
It includes millions or even billions of GPS coordinates with speeds, of vehicles driving on our roads. It is a powerful data source for analysis, as it enables answering many traffic and road safety questions, not possible with data that is already aggregated at the street segment level.

However, few tools exist that can cope with the large amounts of data records, leaving traffic analysts to resort to custom data science workflows. This ad-hoc way of working often takes so much time and effort that floating vehicle data remains unused.
Where to Use Floating Vehicle Data from Connected Cars?
Xouba, a xyzxt.ai partner and innovative Spanish road safety and mobility analytics company, with offices in Europe and the US, is on a mission to bring traffic accidents down to zero. It is using floating vehicle data to help government agencies to gain insight into the main road safety issues.
Floating vehicle data is a popular type of connected car data, and is used to learn more about
- Impact analysis and traffic circulation after road closures
- Congestion and speed analysis
- Origin destination and much more
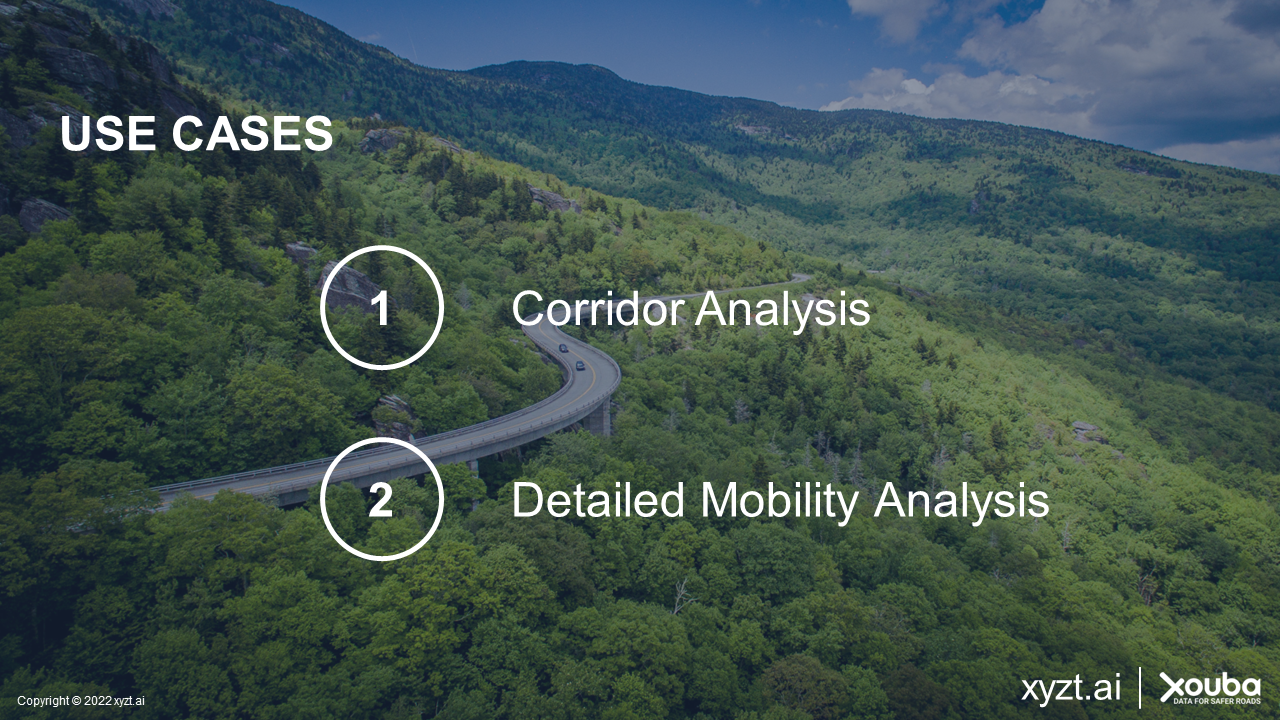
In the webinar the following road safety use cases will be discussed:
- Analysis of a corridor including travel times, speeds etc.
- Detailed mobility : specific movements on roundabouts and
in congestion zones
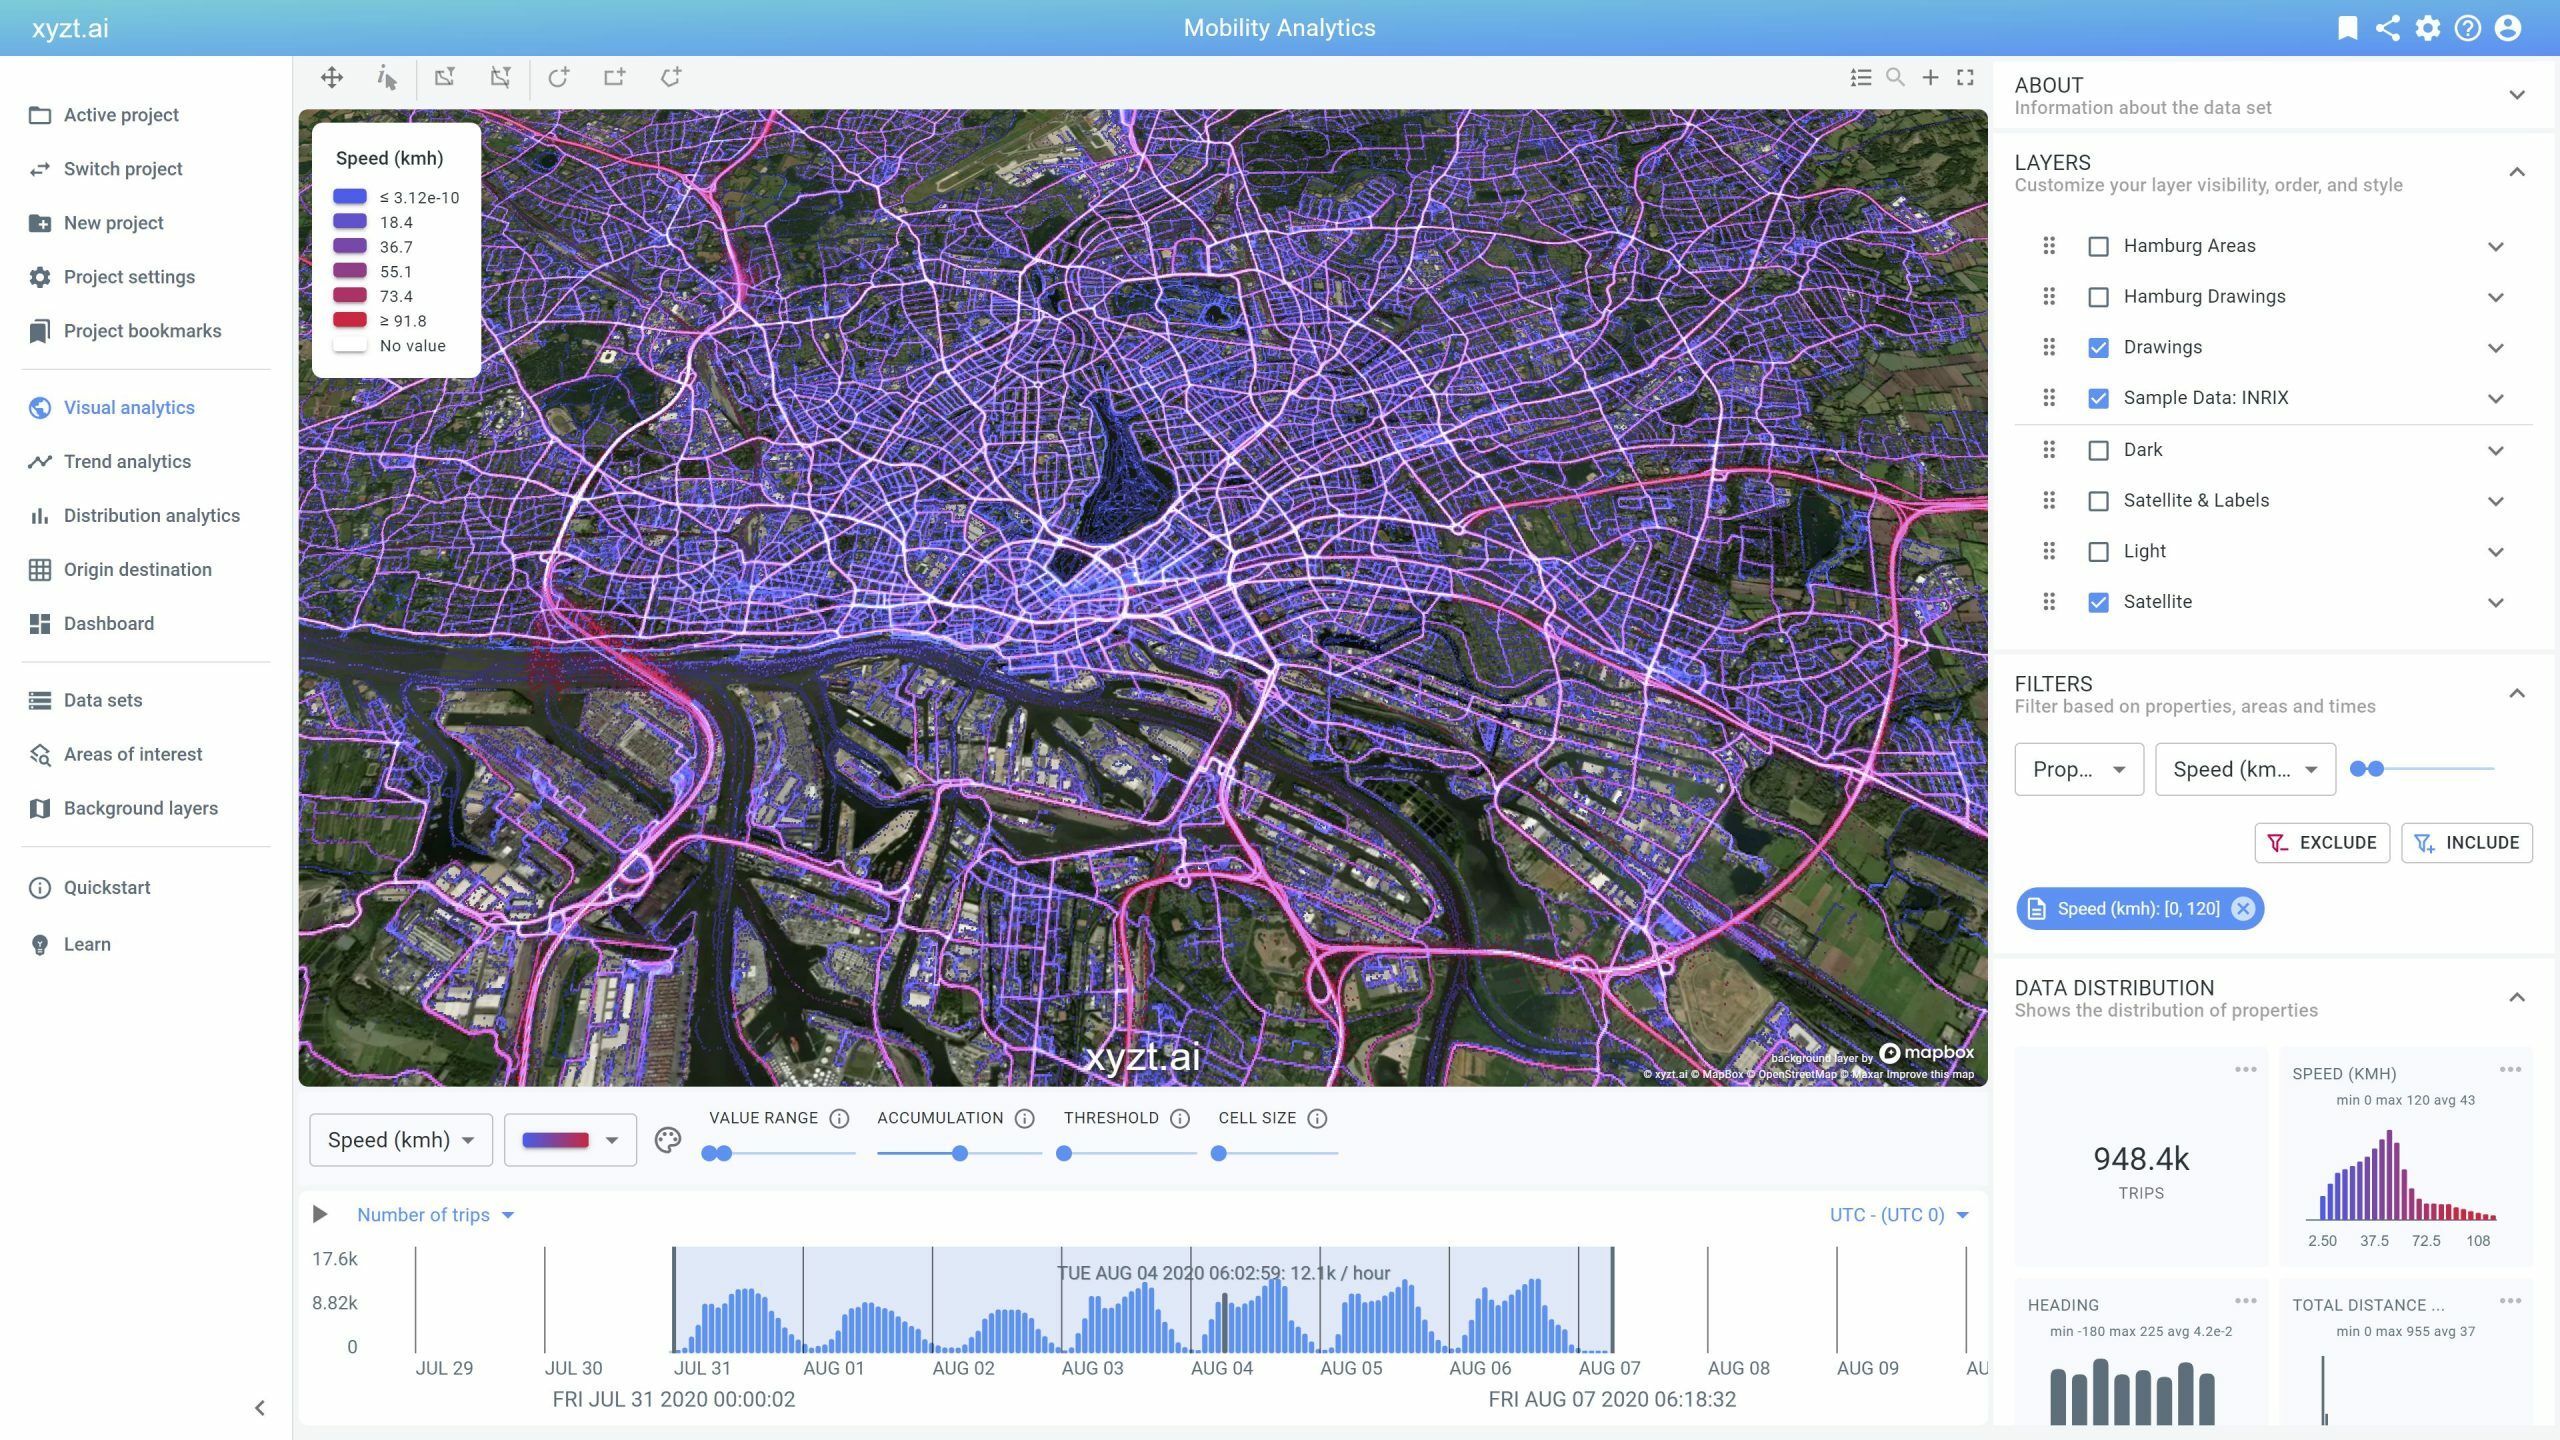
Traffic Analysis: bring down time to insights from weeks to minutes.
Xouba selected the xyzt.ai platform and by doing so has moved from a time-consuming data science workflow to an efficient no-code/low-code data analysis workflow.
As a result, Xouba has reduced time to insight from weeks to minutes. It uses the xyzt.ai platform not only for analysis tasks, but also for creating insightful reports to share with their stakeholders.
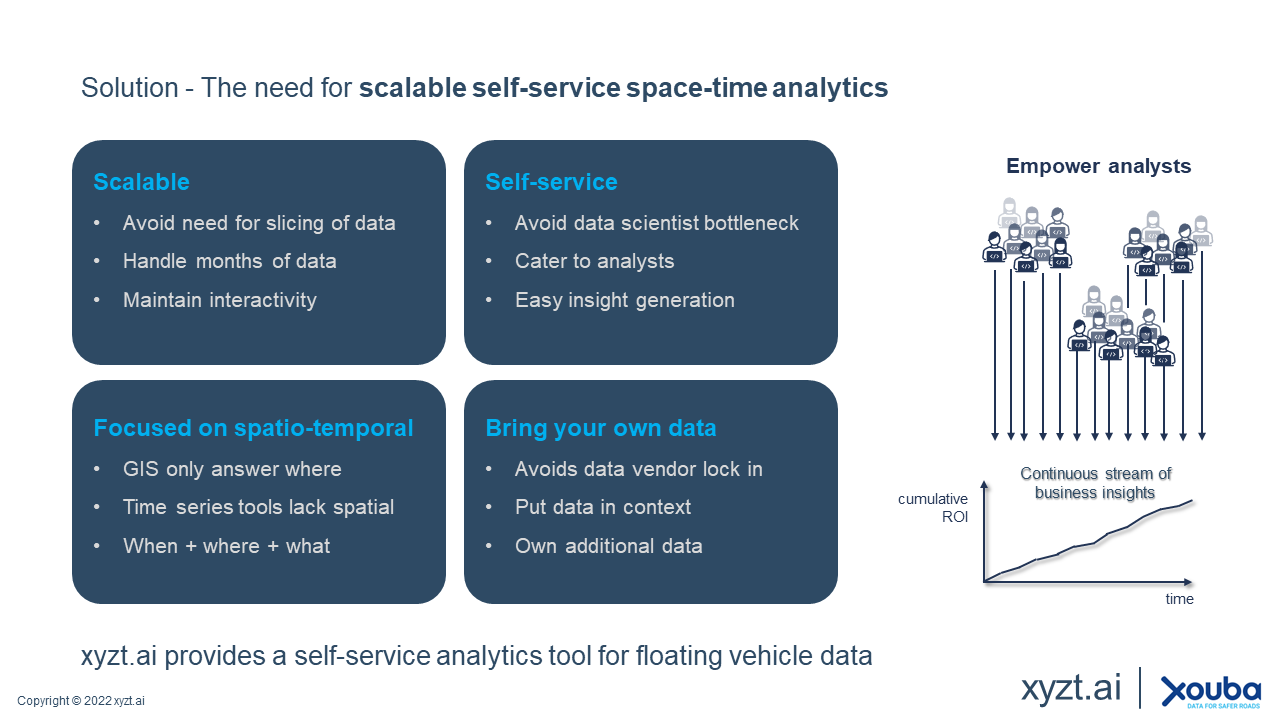
xyzt.ai is selected by its customers for :
- Scalability
- Self Service analytics
- Focus on spatio-temporal
- Bring your own data
“It takes on average 3 months for our data scientists to start extracting insights out of movement data. With xyzt.ai tool we could do it in half an hour.”
VP of Data
Use Cases and Key Take-Aways
Register here for the full use cases and key take-aways that have been discussed during the webinar
Contact us
If you have any other questions, or if need help with your data visualization and analysis needs, please contact us.