How does the xyzt.ai platform work?

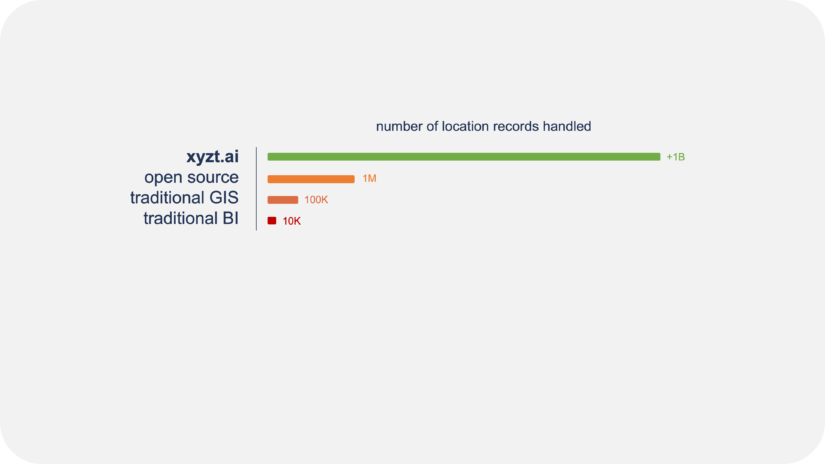
xyzt.ai is a powerful end-to-end location analytics tool for large space-time location data sets. We take care of ingesting, storing, analyzing, and visualizing your data.

The platform is meant for data analysts and data scientists, and can be used without coding (no-code!), or interacted and integrated with through a REST API.

Through 4 simple steps you upload your own data, define or upload your regions of interest, perform interactive visual analysis, and share dashboards.

1. Connect your data

Connecting your data is as simple as drag’n’dropping your data files. Or if you are dealing with huge data sets or a real-time data stream, use a simple REST API to connect your data.

2. Define your areas of interest

Define the areas and time slots to monitor or analyze. Choose from the many analytics and alerting blocks such as wait time analysis, density analysis, origin-destination analysis, dwell time analysis, and more.

3. Visually analyse your insights

Start from the insights discovered by the platform and further drill down using the highly interactive visual analytics capabilities. Also for data sets with billions of location records. Finding the root cause of an event or anomaly has never been easier.

4. Share your dashboards

Invite your coworkers to your project, and share dashboards with stakeholders. Away with dull static reports in printouts, here come the interactive and beautiful dashboards accessible on any device.

Your benefits? Instant analytics, effortless insights.

Dive into the documentation

Scalable visualization and analytics

When tracking assets, vehicles, crowds, you quickly accumulate billions and billions of data points. Our platform allows you to ingest your data through the xyzt.ai web application or through an easy REST API. When analyzing or visualizing your data we stream the results in the most efficient way for you to obtain your insights instantly and effortlessly, even in the case of multiple billions of data points.

Understand where and when

Traditional geospatial tools lack support to handle the temporal dimension, while traditional time series tools cannot handle spatial data well. We feel your pain. No more: xyzt.ai is built from the ground up as a unique platform that empowers analysts to look at all dimensions. When and where combined throughout all analytics and visualizations.

Interactive visual analytics as a game changer

xyzt.ai is a visual analytics platform that provides instant feedback when you need overviews or need to dive deep in your data, e.g., by filtering in space, time, or based on your data properties. Get immediate feedback on the map, timeline, and in interactive statistics such as data distributions, percentiles, and more. Even for Big Data!

Your data, any data

The platform and analytics adapts to any data source, being it floating vehicle data, maritime AIS data, traffic counting data, time series data, sensor IoT data,... You can define your own data schema and upload any spatio-temporal data source.