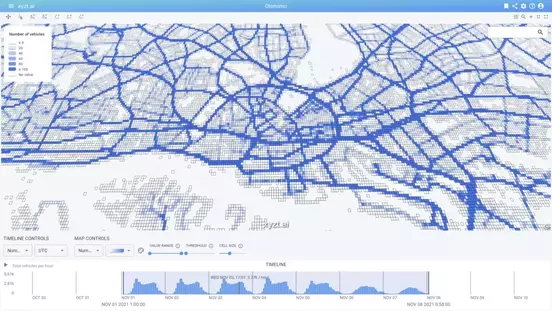

Mobility & Traffic

Understand traffic and mobility patterns across your entire network.


Explore traffic flows, compare locations and time periods, uncover patterns, and answer new questions without building custom dashboards or analytics tools.


From road authorities and traffic agencies to system integrators and data providers, xyzt.ai helps teams turn complex mobility data into practical insights for planning, operations and road safety.


Analyze traffic and mobility data at scale

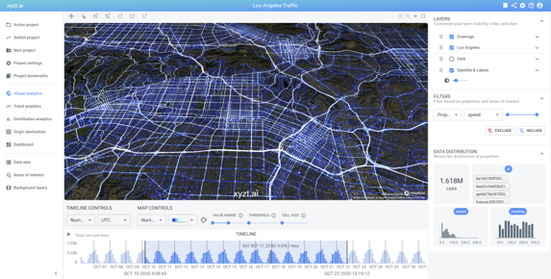
Connected vehicles, traffic sensors and other mobility data sources generate enormous volumes of information every day. xyzt.ai helps you explore this data interactively, from individual roads and corridors to entire regions and longer time periods.

Combine floating vehicle data with traffic counts, trips, road incidents or other mobility data to build a more complete picture of what is happening across your network.

Explore the xyzt.ai platform

Work with the mobility data you already have

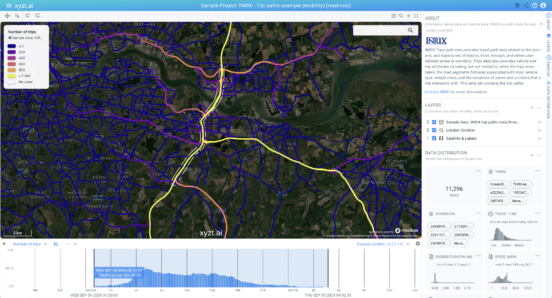
Use data from providers such as INRIX, Bridgestone, HERE and TomTom, or bring your own data format.

xyzt.ai supports floating vehicle data, trip data, event data and other mobility sources, so you can analyze different data sets in one environment.

How we deal with any location data

Explore traffic patterns and answer new questions

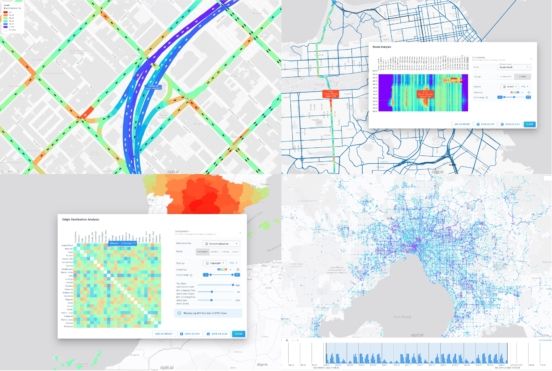
Use built-in analytics to understand traffic flows, speeds, travel patterns and changes over time.

Explore origin-destination patterns, trends and distributions directly on the map. See where traffic comes from and goes to, compare time periods, identify unusual behavior and investigate specific mobility or road safety questions.

Delve into our user benefits overview

Put your mobility data in context

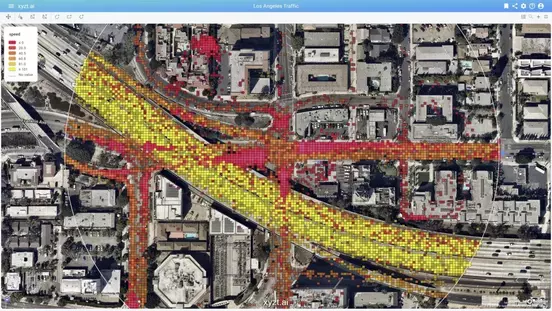
Combine mobility data with aerial imagery, road networks, weather, atmospheric data or other contextual sources.

Seeing different data sets together makes it easier to understand why patterns occur and how traffic conditions relate to the wider environment.

Share your findings clearly

Turn your analysis into interactive dashboards with maps, timelines, charts and other visualizations.

Share results with colleagues, policymakers, customers or the public through a link, or embed dashboards directly into your own platform or website.

How to share your insights using xyzt.ai

Keep sensitive data protected

xyzt.ai processes analytics and visualizations server-side, while data remains encrypted at rest.

Configure aggregation levels and hide identifiers to reduce exposure of individual trips and support privacy-conscious analysis.

Contact us to learn more about how xyzt.ai protects privacy.

  • Customer case

    Helping municipalities and traffic agencies gain insight in heavy traffic and road safety with Bridgestone

    Bridgestone is a provider of floating vehicle data, data that includes GPS traces, data about dangerous situations such as acceleration, breaking, and cornering, and other events. By partnering with xyzt.ai, road safety and traffic analysts can now gain easy insight through interactive visual analytics on these rich data sets.
    Discover this use case
  • Customer case

    How INRIX helps their customers with instant visual analytics for floating vehicle data

    INRIX is one of the fastest-growing Big Data technology companies globally, that works closely with leading automakers and government agencies to transform how people and commerce move around the world’s transportation networks. The xyzt.ai solution enables the INRIX customers to quickly and easily use INRIX data for traffic-related analysis purposes and to immediately gain important insights for planning purposes without any programming effort.
    Discover this use case
  • Customer case

    Combining floating vehicle and traffic counting data for traffic data analysis at Helsinki

    The City of Helsinki partnered with xyzt.ai and GeoMobility to research the different traffic and mobility data sources and use cases for data-driven analytics with the xyzt.ai platform.
    Discover this use case
  • Customer case

    How Crowdscan provides cities and event organizers with people flow visibility

    Crowdscan helps cities and organizations monitor and analyze people flow using innovative privacy preserving sensor technology. Learn how Crowdscan leverages the xyzt.ai platform to provide their end users with an easy situational awareness dashboard.
    Discover this use case
  • Customer case

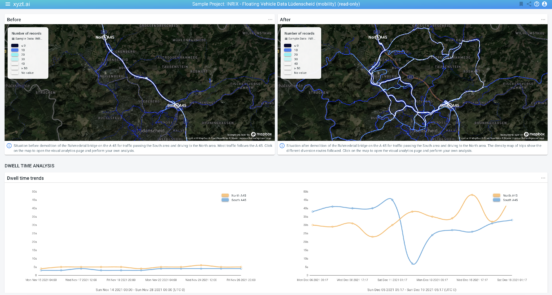
    How Xouba uses floating vehicle data for road safety and incident analysis

    Xouba is helping traffic departments understand traffic flow and road safety. By leveraging the xyzt.ai platform that drastically accelerate time to insight compared to the old way of working using custom Python scripts.
    Discover this use case
  • Customer case

    Optimal Truck EV Charging Location Analytics | Kallista Energy Case Study

    Logistics and trucking companies are planning for electrification of their fleet. At the same time, energy companies are preparing for a new demand in EV charging infrastructure for trucks. But where to invest in a new installation? What are the best optimal locations. Using Bridgestone floating truck data and the xyzt.ai platform, Kalista Energy's analysts could easily identify the most optimal sites in France.
    Discover this use case
  • Customer case

    Traffic Analysis & Reporting with Floating Vehicle Data | Hamburg Mobility Case

    Hamburg, a major city in Germany, Europe, sees large volumes of traffic, including from and to the port area. Using floating vehicle data from INRIX and the xyzt.ai visual analytics platform, analysts at City of Hamburg can easily analyze and report on any traffic and mobility question.
    Discover this use case
  • Customer case

    Traffic Flow Analytics with Floating Car Data (FCD) | Straßen.NRW Case Study

    The State Traffic Management Center of North Rhine-Westphalia (Straßen.NRW) in Germany has adopted the xyzt.ai platform for various use cases, involving the analysis of traffic flows and traffic management strategies using Floating Car Data (FCD). Learn how their traffic analysts obtain unprecedented insights into traffic flow conditions on the German roads.
    Discover this use case

Why choose xyzt.ai?

Work directly with large volumes of floating vehicle, trip and mobility data without waiting for custom scripts, pipelines or dashboards to be built.

Explore traffic across large regions and long time periods, filter and compare data interactively, and use built-in analytics such as corridor and origin-destination analysis.

Answer new questions in seconds, share results quickly and adapt your analysis as mobility challenges evolve.

For whom?