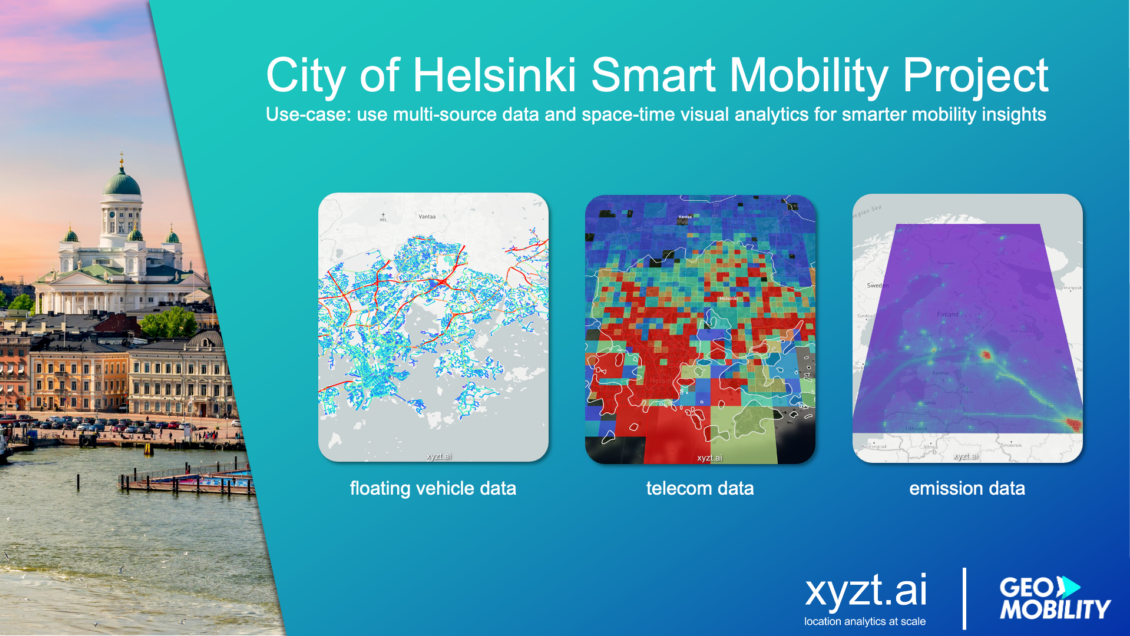
Cities and governments are increasingly adopting a data-driven mobility analytics strategy. However, the plentitude of data providers and data sources makes it increasingly more difficult for analysts to understand what is available and what use-cases can be solved.
Combining floating vehicle and traffic counting data for traffic data analysis at Helsinki

The challenge
The solution
xyzt.ai partnered with the City of Helsinki and Geo Mobility to help the city analysts understand the broad range of different data sources available, the benefits and limitations and how to combine and leverage the different data sources for mobility analytics in the xyzt.ai self-service platform.
One month of different data sources were obtained and investigated:
- Here aggregate floating vehicle data
- TomTom aggregate floating vehicle data
- INRIX floating vehicle data
- Geo Mobility ODIQ routing data
- Own traffic counting data
- Own GIS data
- Telia aggregate telco data
- EU Copernicus atmospheric monitoring data
”The City of Helsinki is developing its traffic data capabilities," says Juho Kostiainen, project manager from the City of Helsinki and Mobility Lab Helsinki. "This pilot with various data sets and visual analytics provides a very interesting look at the possibilities for different use cases.”
Results
The project was successful and resulted in a better understanding by the City of Helsinki analysts. The project revealed that there are a large number of useful data sources available for Finland with very good coverage for Helsinki. In addition of handling the different data providers' data sources, it showed that combining with own data sources (traffic counters, GIS layers) was of equal importance to the city analysts and the use of a single platform that can fuse all different data sets proved extremely valuable.
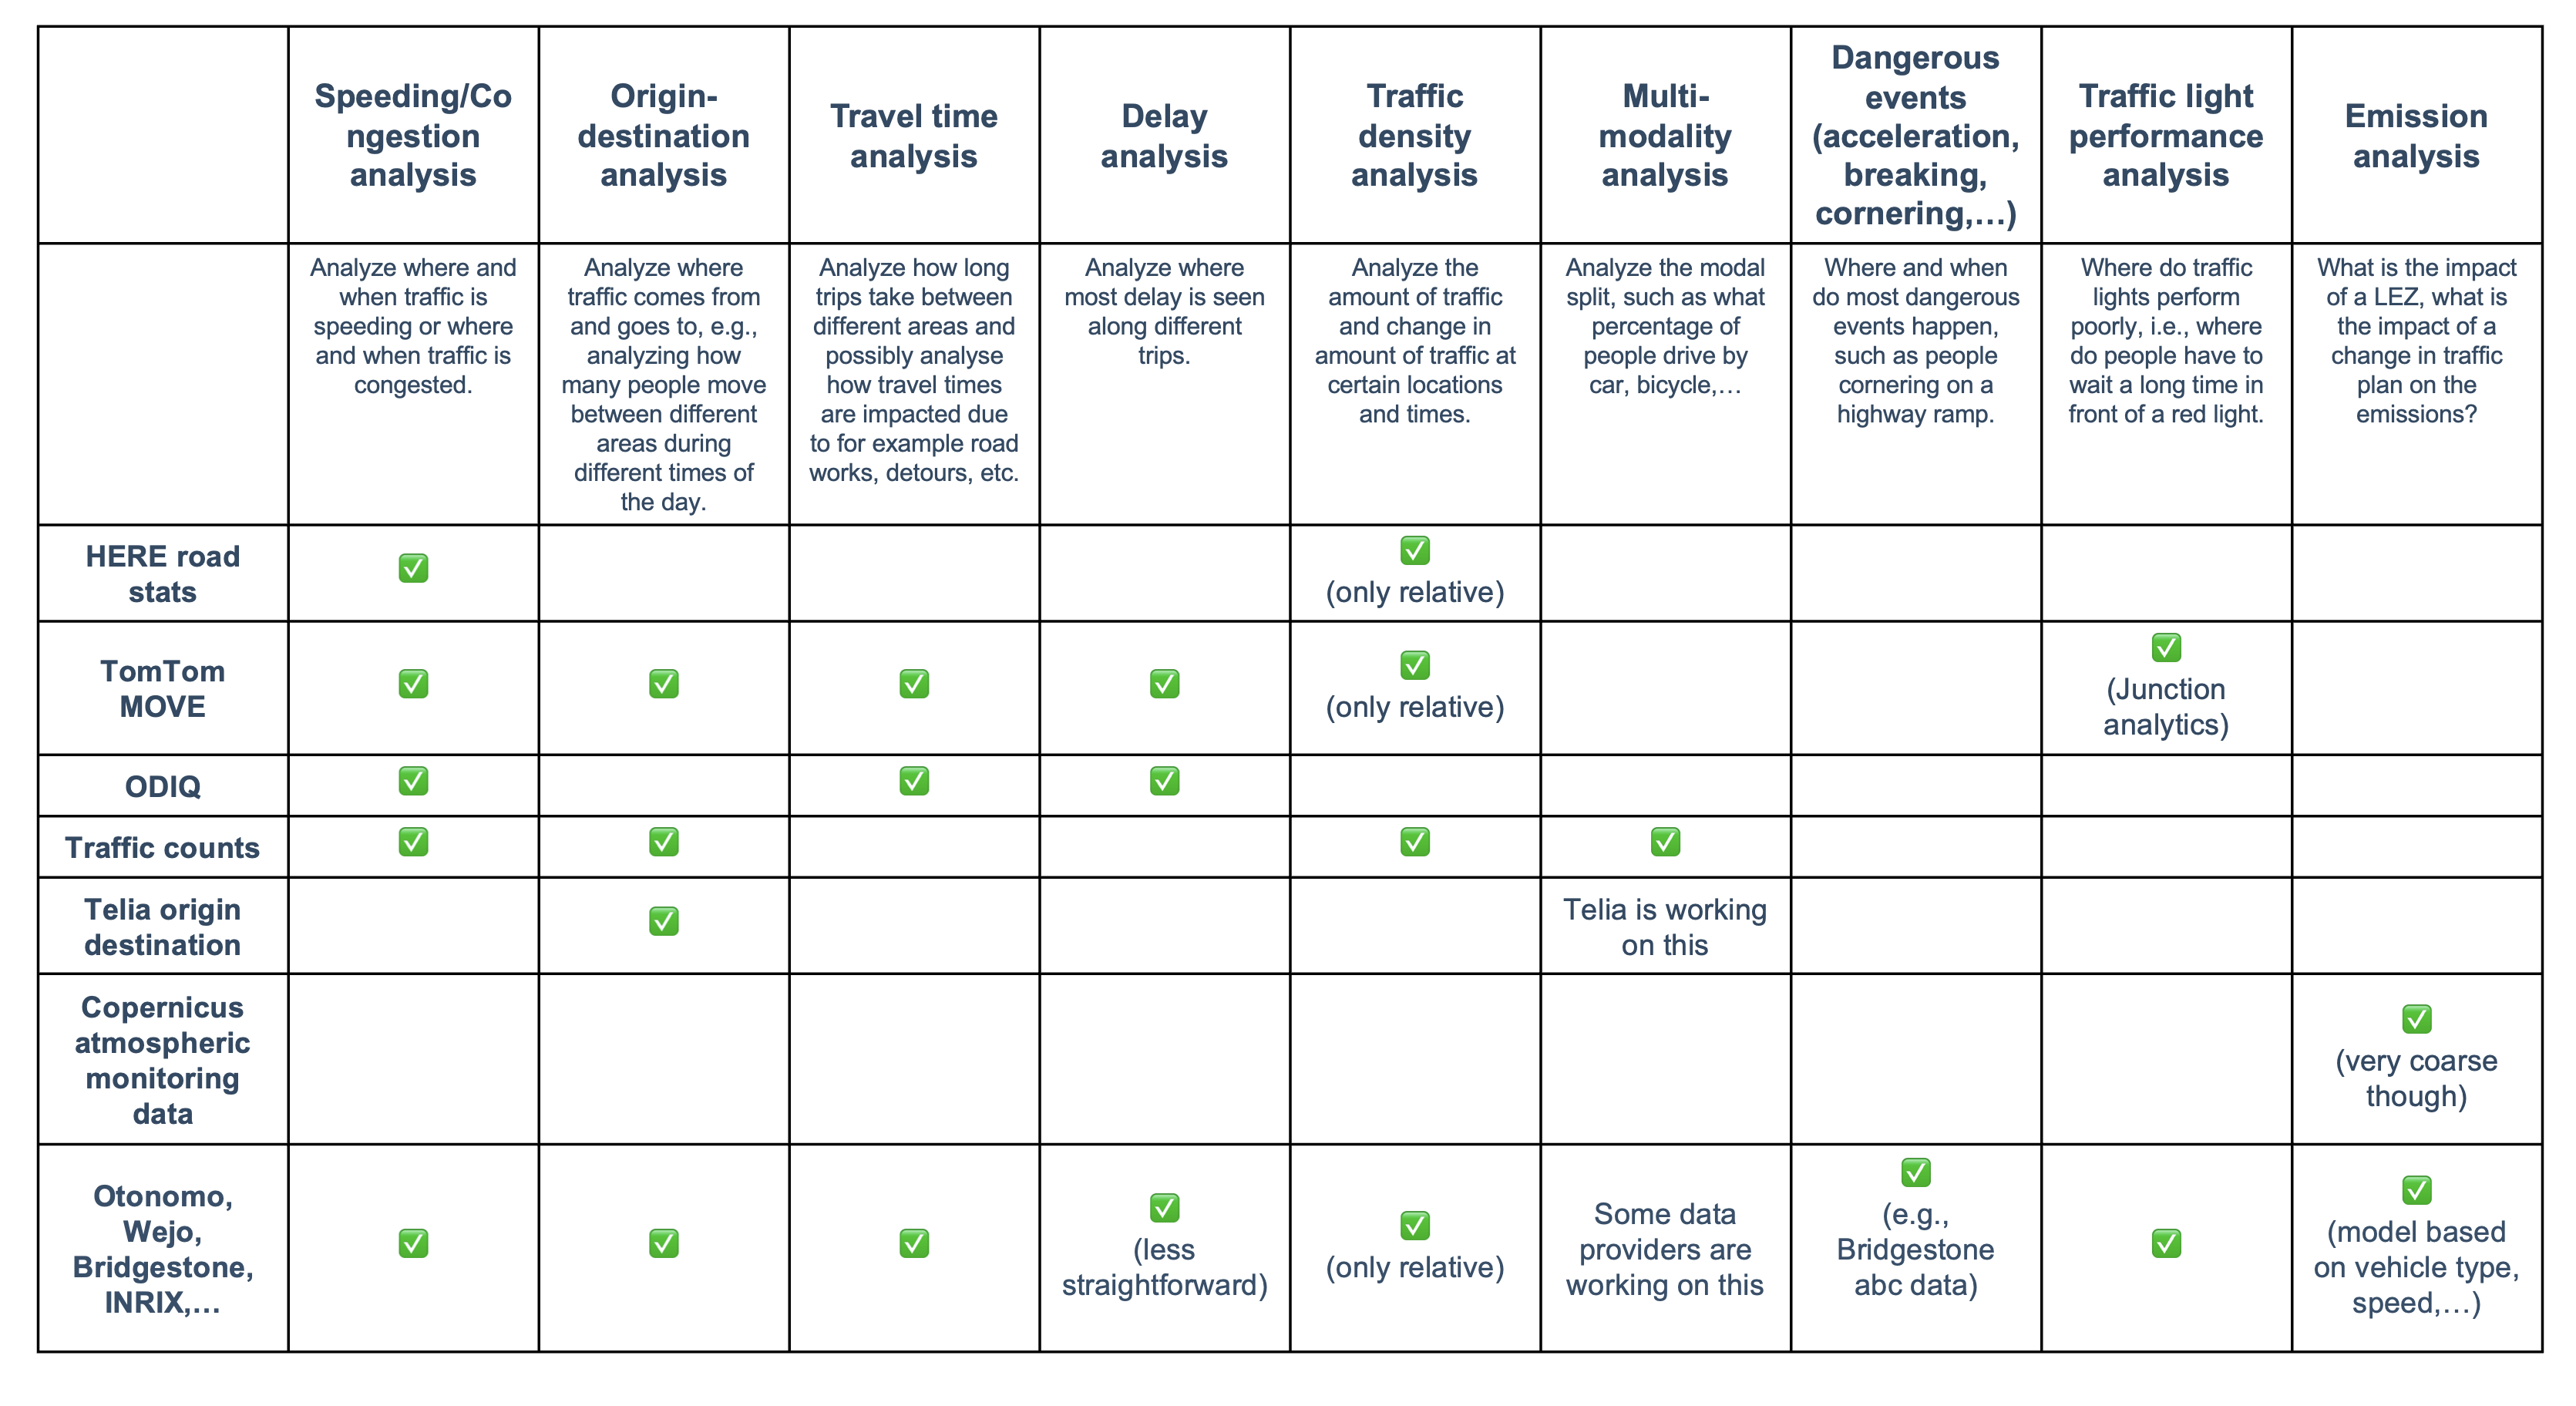
Below is a summary table compiled during the project, mapping the different data sources to the different mobility analytics use cases:

If you'd like to know more about how we can help you get the most out of your traffic data, feel free to request a demo.
