Traffic Flow Analytics with Floating Car Data (FCD) | Straßen.NRW Case Study
The State Traffic Management Center of North Rhine-Westphalia (Straßen.NRW) in Germany has adopted the xyzt.ai platform for various use cases, involving the analysis of traffic flows and traffic management strategies using Floating Car Data (FCD). Learn how their traffic analysts obtain unprecedented insights into traffic flow conditions using the xyzt.ai platform.
The challenge
The State of North Rhine-Westphalia is one of the largest and most populous states in Germany with 17.9 million inhabitants. Major road works hence can have a huge impact on the traffic flow and economy. Multi-year closures of highways due to structural damages to bridges, the traffic management center is facing severe challenges in managing traffic and implementing different traffic measures such as diversions.
The state has multiple hundreds of traffic counters along the highway network. Unfortunately, traffic counters are still sparsely distributed and do not provide good insights into traffic flows. Therefore Straßen.NRW chose to adopt Floating Car Data (FCD) analytics using the xyzt.ai platform.
The solution
To obtain better insights into traffic flows, Straßen.NRW chose to leverage Floating Car Data analytics. Float Car Data (FCD) is the aggregate collection of GPS positions of vehicles on the roads, with associated time stamps, speeds, vehicle type, etc. The data provides large-scale statistical insights about how traffic flows and is the ideal source for analysis with the xyzt.ai platform.
Straßen.NRW selected INRIX as the FCD data provider and the xyzt.ai platform for analytics. Using about 500 million daily records and the interactive visual analytics capabilities the analysts can now see and understand traffic flows and the changes on the network.
"Thanks to the xyzt.ai platform, we've gained unparalleled insight into traffic dynamics across North-Rhine Westphalia. With its intuitive traffic flow filters and dynamic visualizations, we can effortlessly grasp the effects of various traffic management strategies, applied for example during major road closures. This innovative no-code analytics solution stands out in its ability to handle complex mobility data, including big floating vehicle data, empowering us to make informed decisions with ease.", Frederik Weistroffer, Project Manager for ITS utilisation Straßen.NRW
Results
Example use-cases for which Straßen.NRW is using xyzt.ai are highlighted below.
Analyzing modal shift caused by road closures in Lüdenscheid and Bottrop
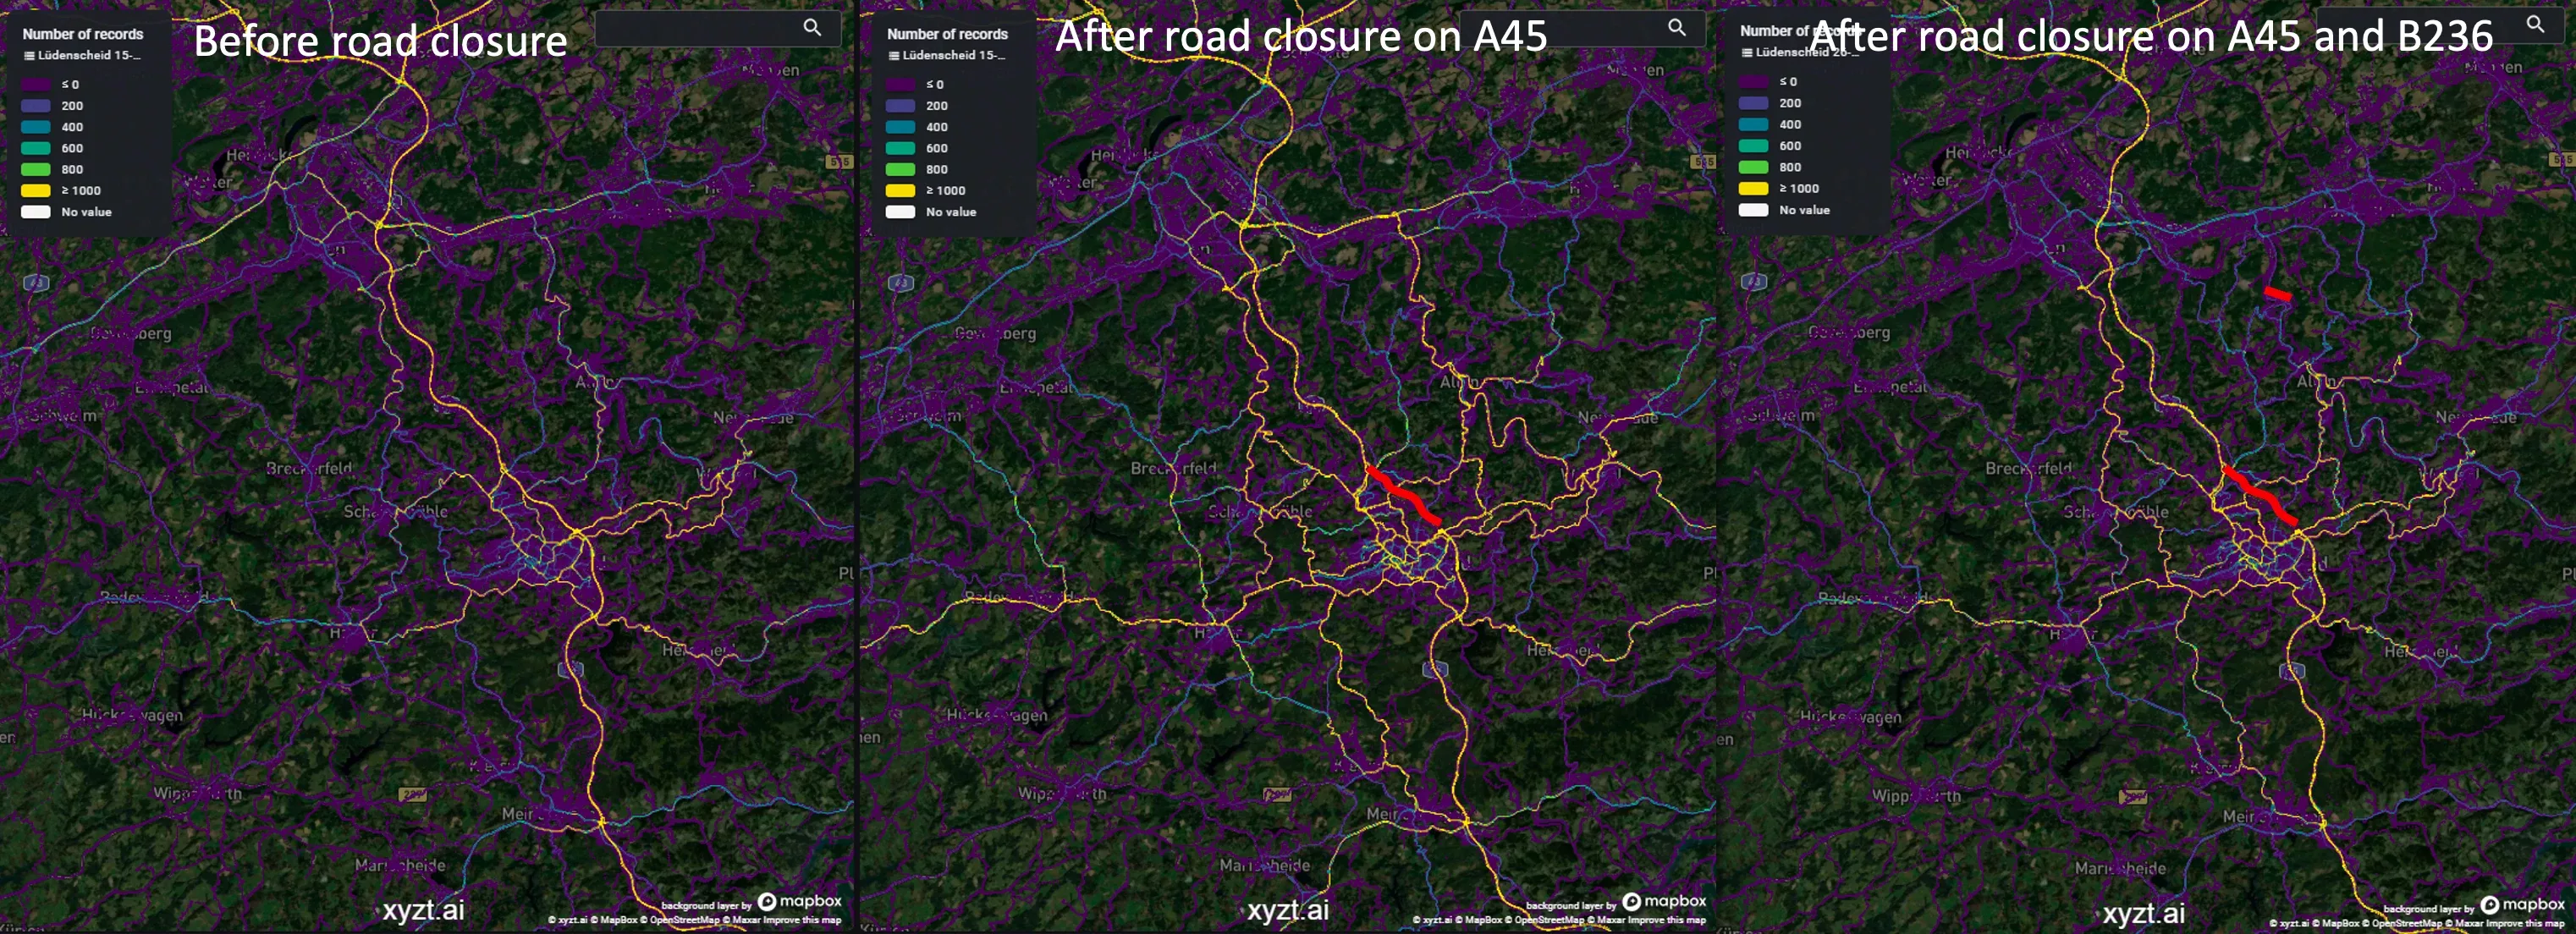
The visual analytics capability enables immediate visual identification and confirmation of modal shifts caused by road closures. As an example, due to the required demolition of a bridge on the A-45 highway near Lüdenscheid, traffic has to be diverted off the highway. Using multi-week analysis and density visualization, the change in traffic flow can be immediately visualized.
Before after analysis looking at traffic density before road closure (left), and during road closures (middle and right).
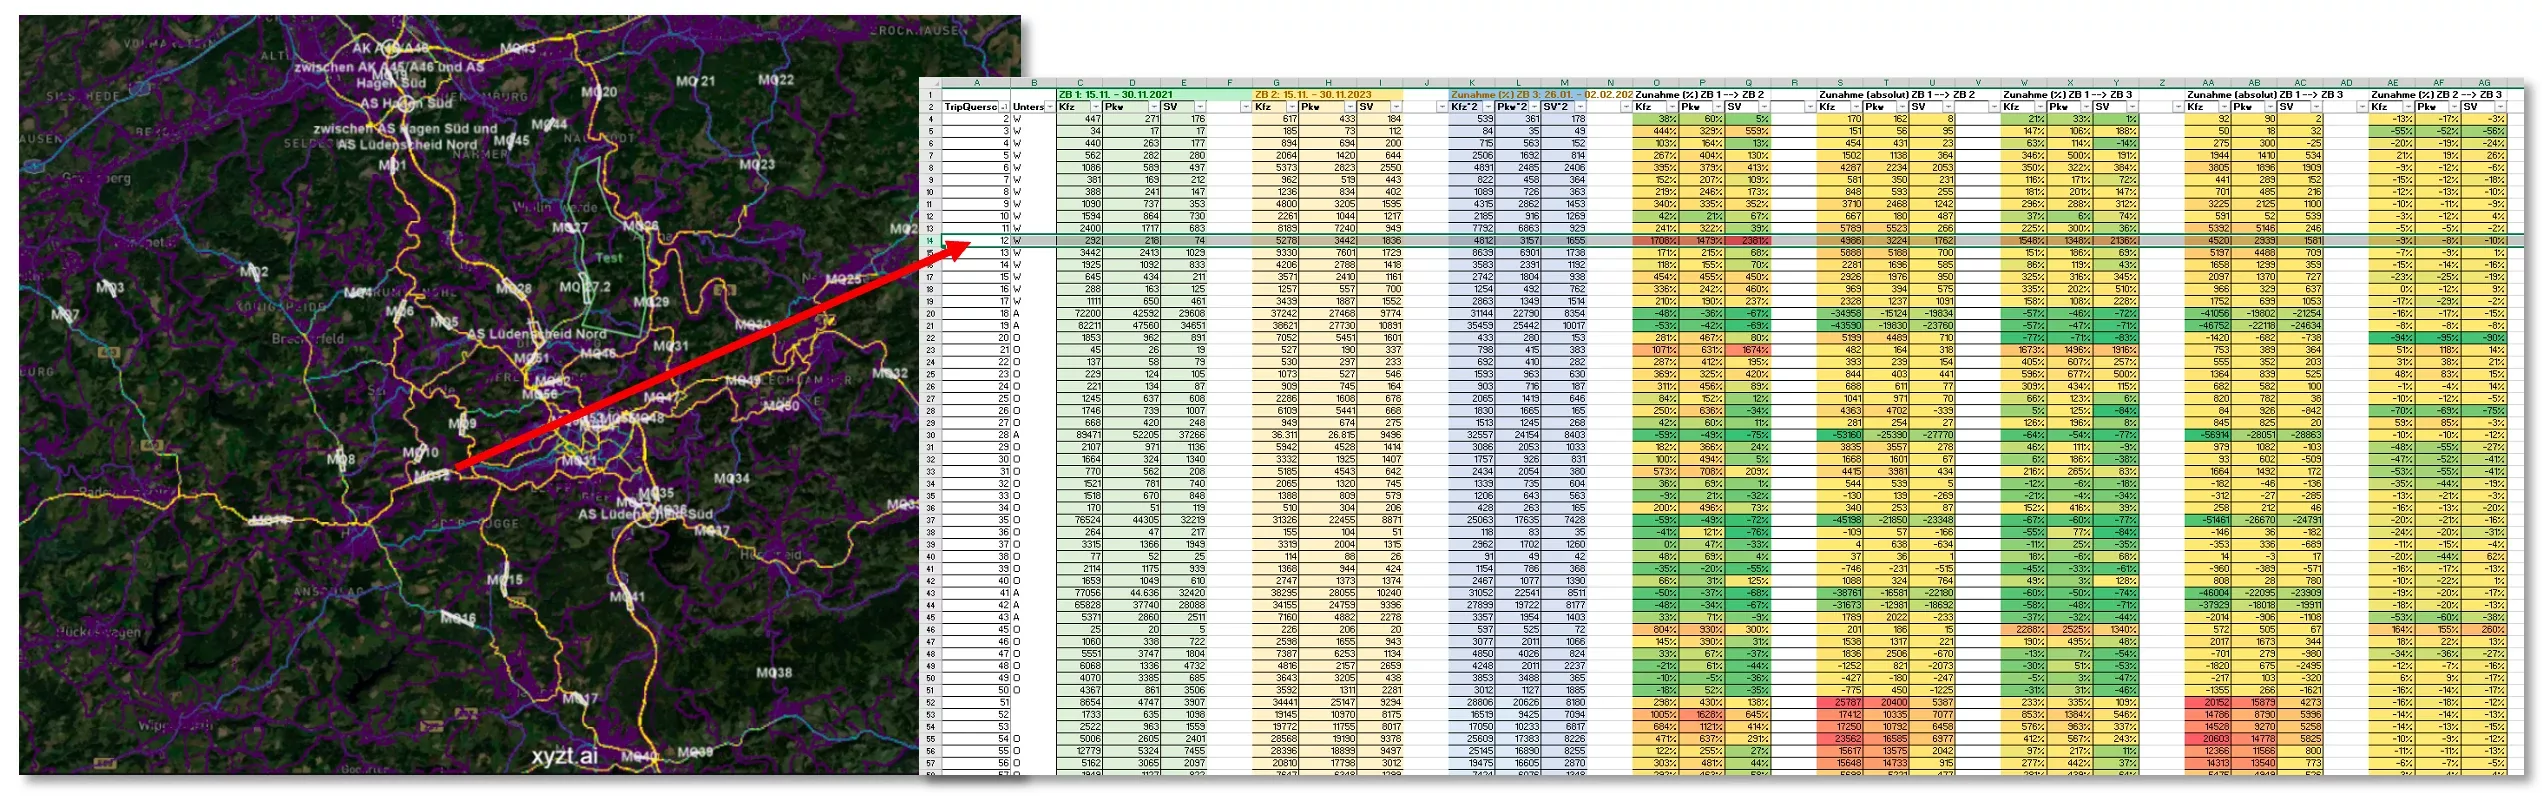
Using spatial filters and counting trips, analysts can easily identify congested roads before and after the road closures. This also gives insight into strategies to implement additional traffic counters.
The xyzt.ai platform enables export of statistics for further analysis in Excel. In this case looking at number of trips at specific locations on the road network to identify congested roads.
As a side note, the analysts also used the xyzt.ai platform with their traffic counter data and confirmed similar trends in the FCD data. Hence making the FCD data suitable for statistical analysis.
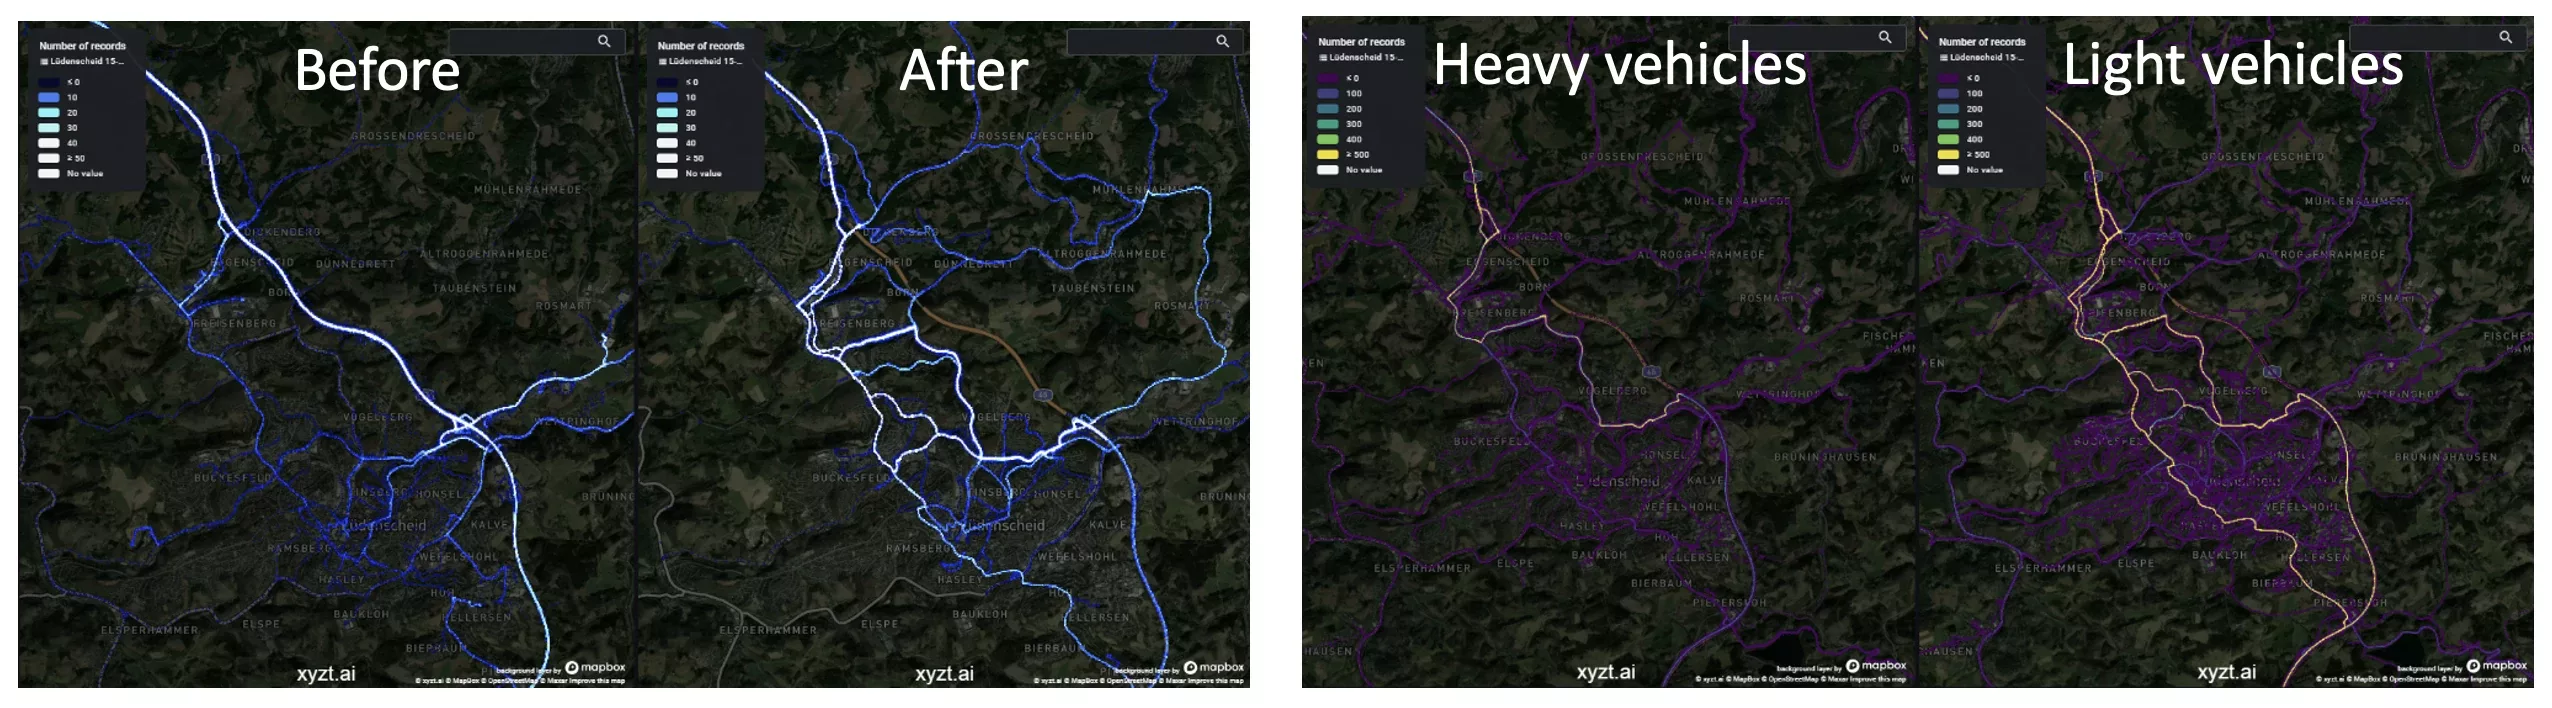
The analysts have also adopted the Advanced Space Time Query Language provided by the xyzt.ai platform, to identify specific route choices to reach specific destinations (like motorway intersections).
Finally, thanks to the capability to also filter on vehicle types, roads with higher risks due to many heavy vehicles can be easily identified.
Filtering enables separating subsets of traffic flows. Left: looking at traffic flowing along specific routes (before and after road closure). Right: looking at different vehicle types separating heavy from light vehicles.
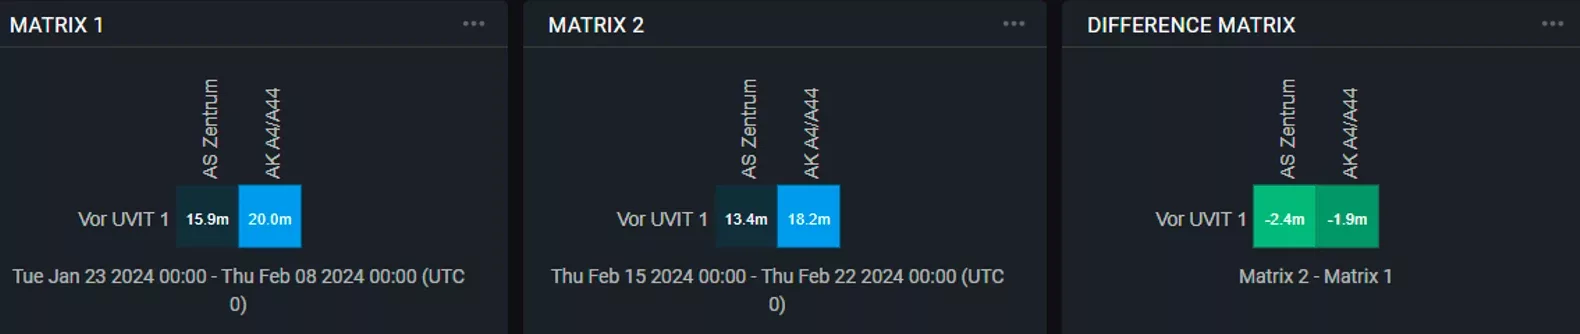
Analyzing the influence of traffic information boards (UVIT) in Aachen
Another use case for analyzing traffic flow is looking at the effectiveness of (mobile) traffic information boards. The boards show travel times for specific route options. Using the xyzt.ai platform, a before and after analysis of traffic densities and travel times following route options can be easily analyzed. As such, the xyzt.ai platform is an ideal tool to analyse traffic measures.
Analyzing (change in) travel times along different route options using the origin-destination analysis capability of the xyzt.ai platform.
If you'd like to know more about how we can help you get the most out of your traffic data, feel free to request a demo.