If you’re new to xyzt.ai, we are a company that provides a big data location analytics platform that allows you to easily extract insights from anything that moves, such as vessels, aircraft, connected cars, and people flow.
In this post, xyzt.ai’s CTO, Bart Adams, will focus on this release’s top features. Read on as you will get to experience the power of xyzt.ai’s V2023.3.
The xyzt.ai platform's top new user benefits
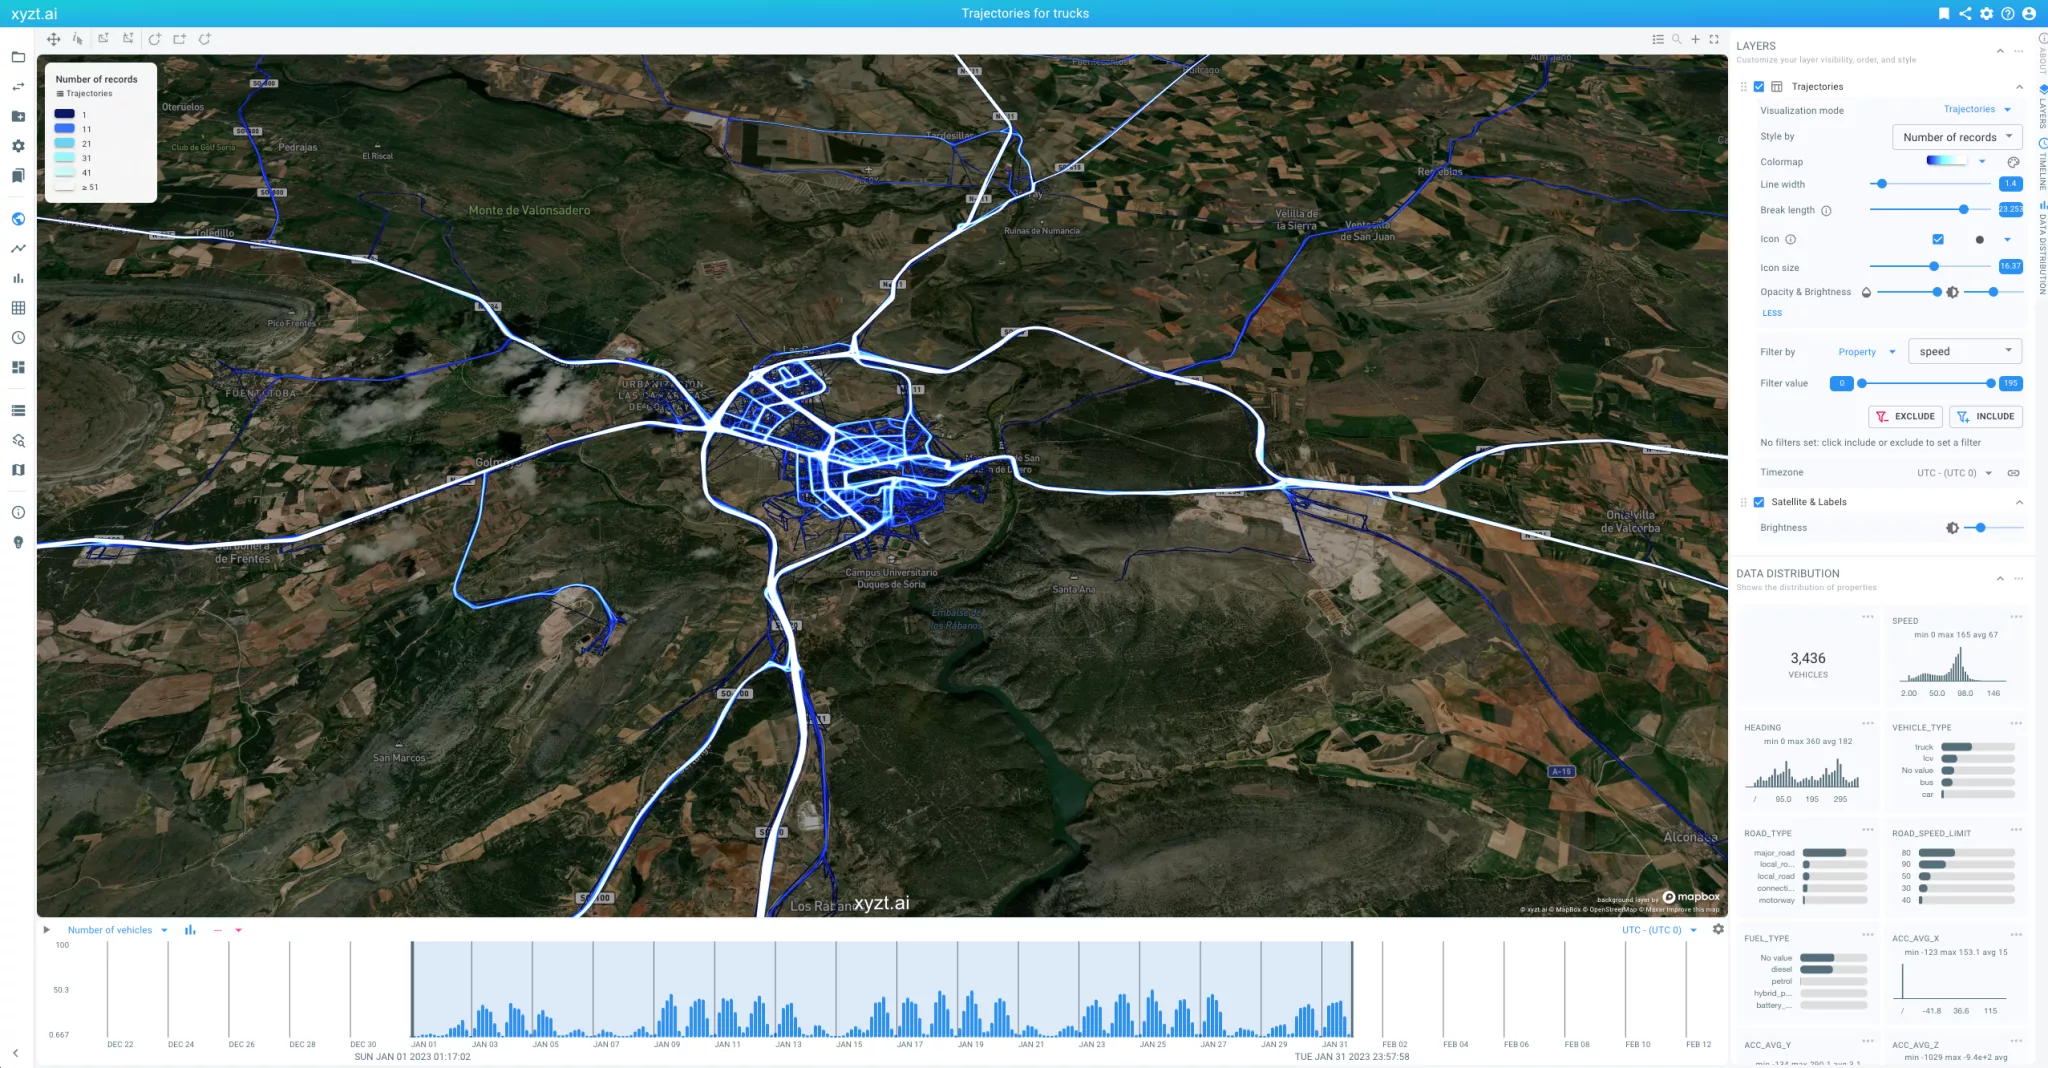
1. Multi-scale trajectories for analyzing movement flows
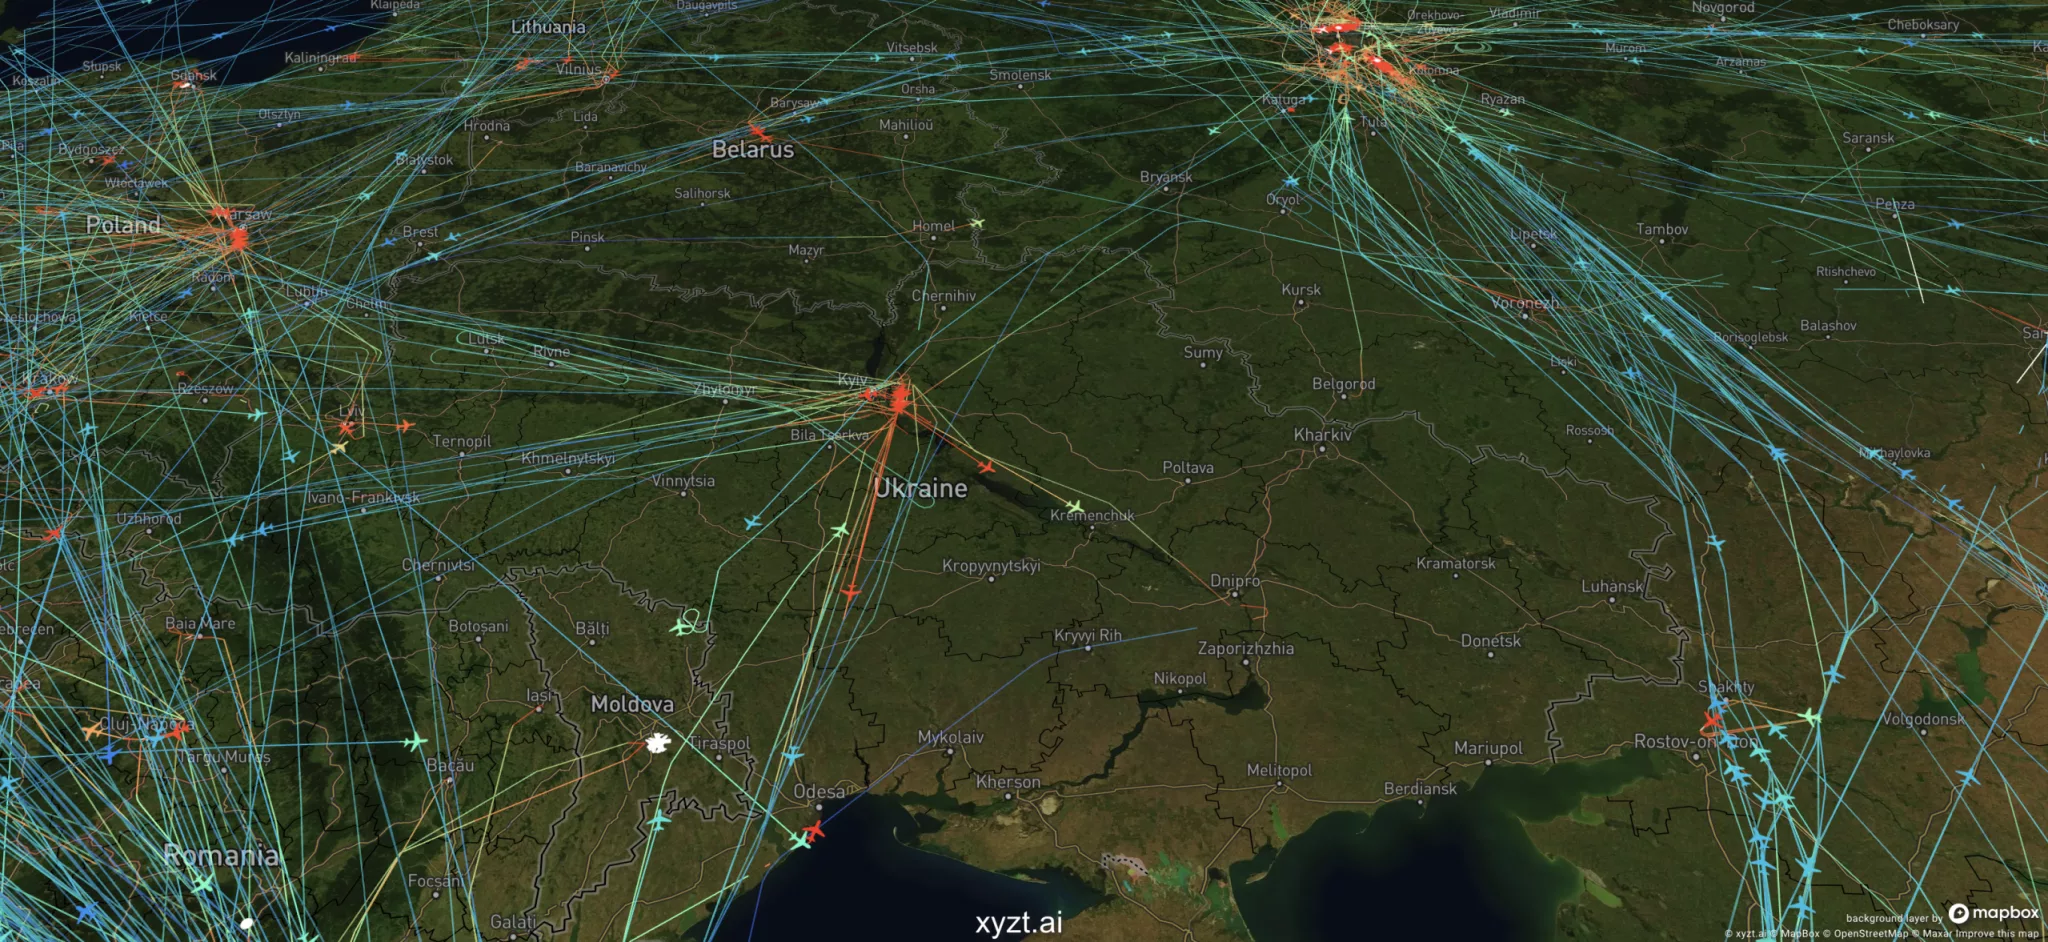
The xyzt.ai platform is now literally connecting the dots and introduces trajectories for movement data.
Similarly to the other data representations, trajectories follow a novel multi-scale tiled data structure that ensures only the relevant data and data at a level suitable for the viewer or analyst is retrieved, avoiding information overload and always ensuring smooth and interactive response times.
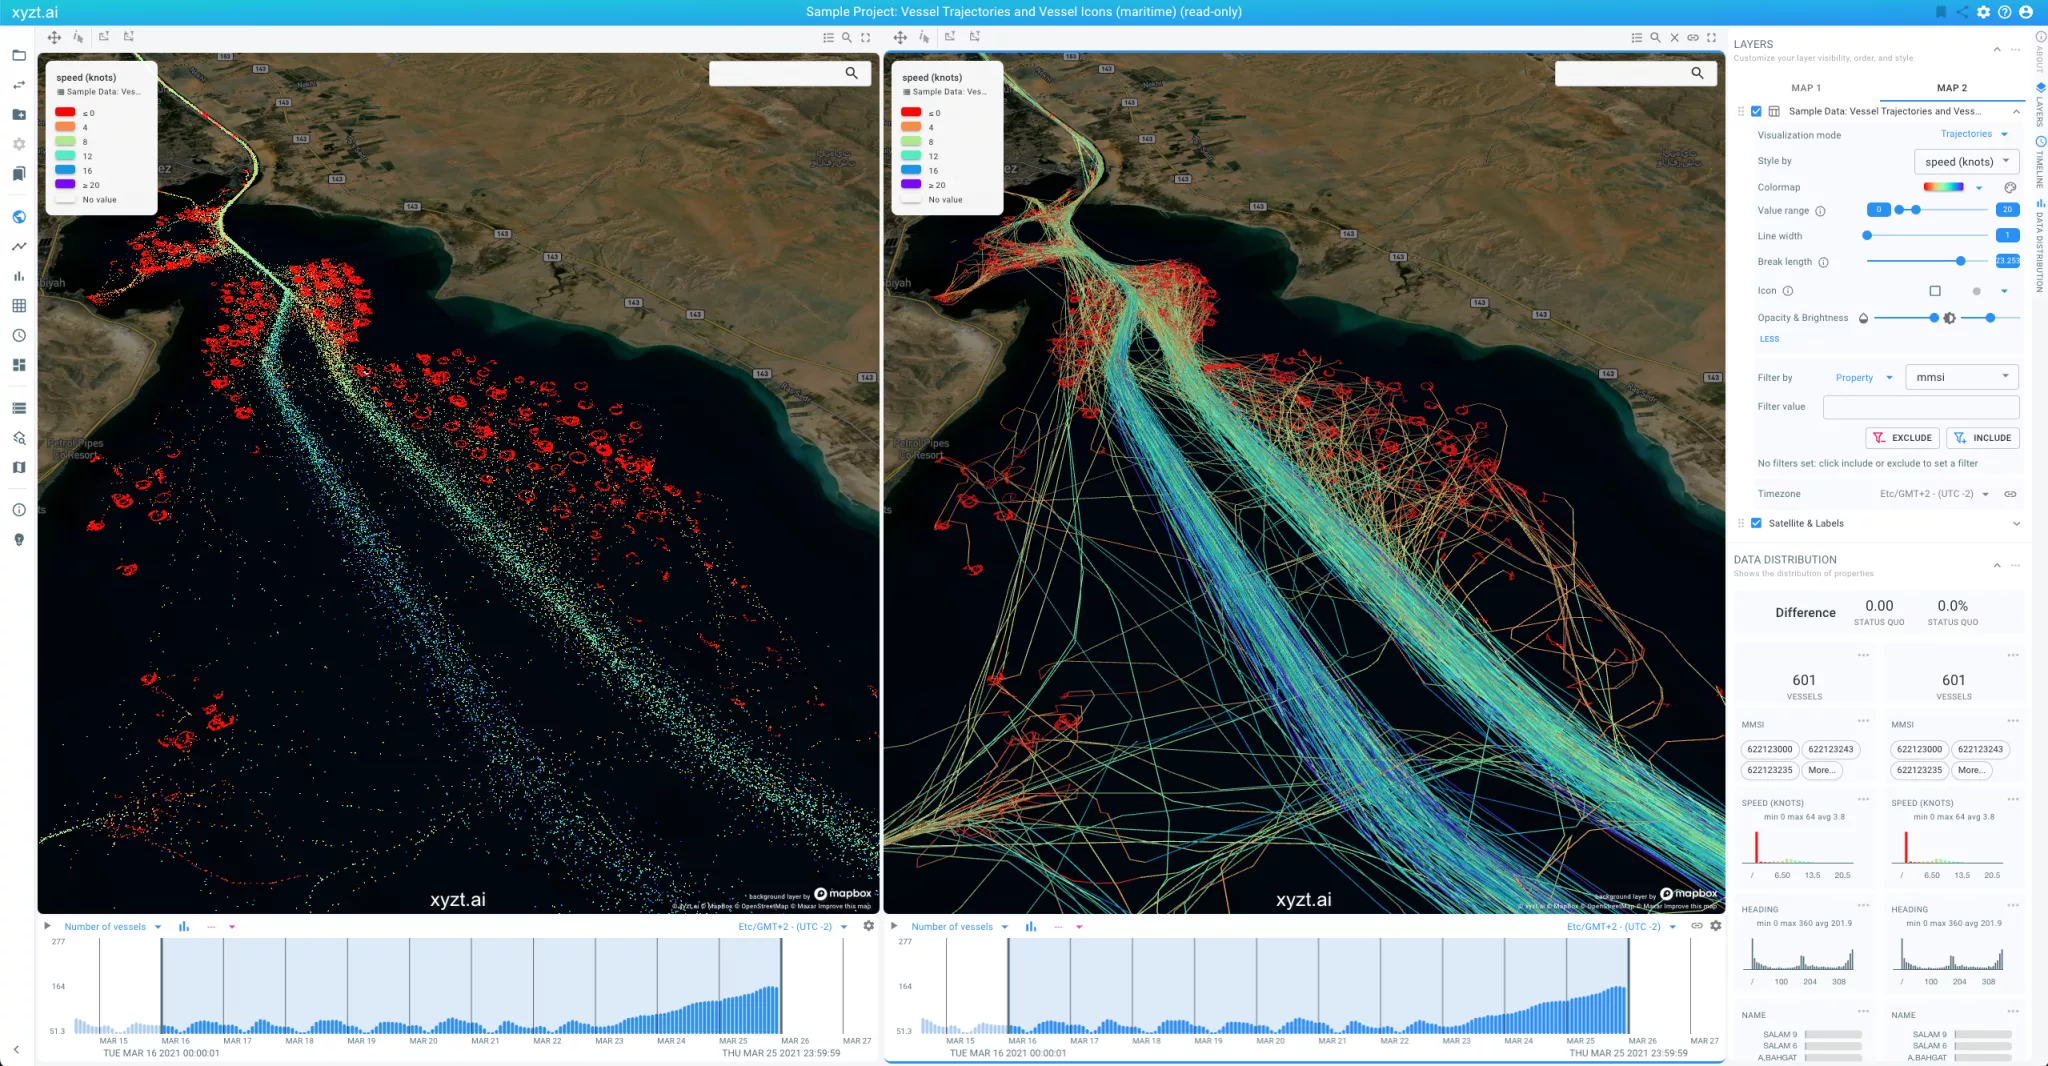
The multi-scale trajectories data representation comes with all the capabilities of the other representations, including data-driven styling and filtering, time-based filtering, and animated replays.
USER BENEFIT
You can now see your movement data as lines which often provides better visualizations when analyzing movement patterns, such as multiple ships moving in a port, or trucks moving through the city center.
2. World-oriented and world-sized icons for accurate incident analysis and replay
Both the trajectories and real-time data representations for movement data, now enable you to visualize an icon with the correct data-driven world-sized orientation and dimensions.
For example, if your data set contains a column with the heading, the width, and the length of, for example, ships, the xyzt.ai platform will paint a ship icon at the correct location, with the correct heading and dimensions.
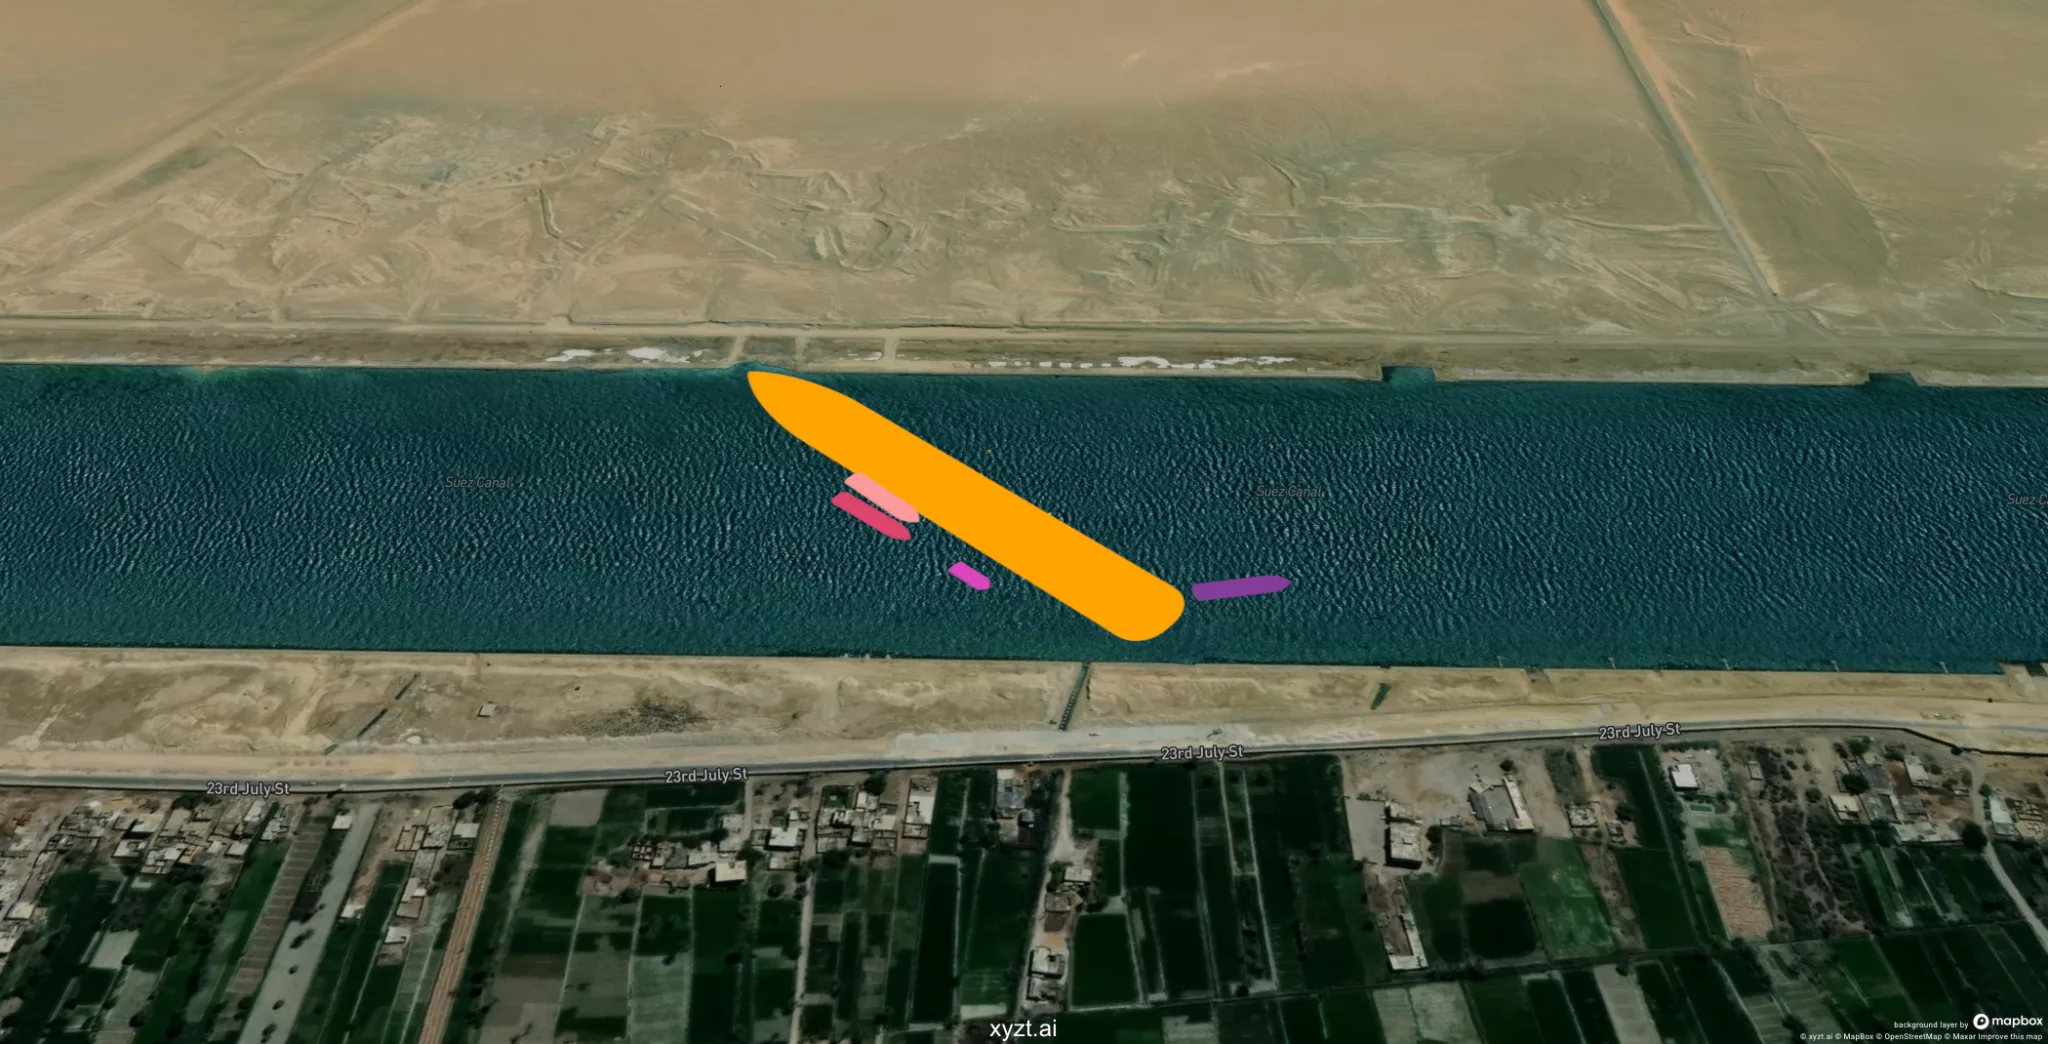
In addition, if you have detailed information of the position of the GPS device (e.g., the AIS transponder), the xyzt.ai platform will take this into account as well. The adaptive icon sizing enables you to see the entities also when zoomed out.
Please consult the documentation for details on how to enable this during data properties definition and data visualization.
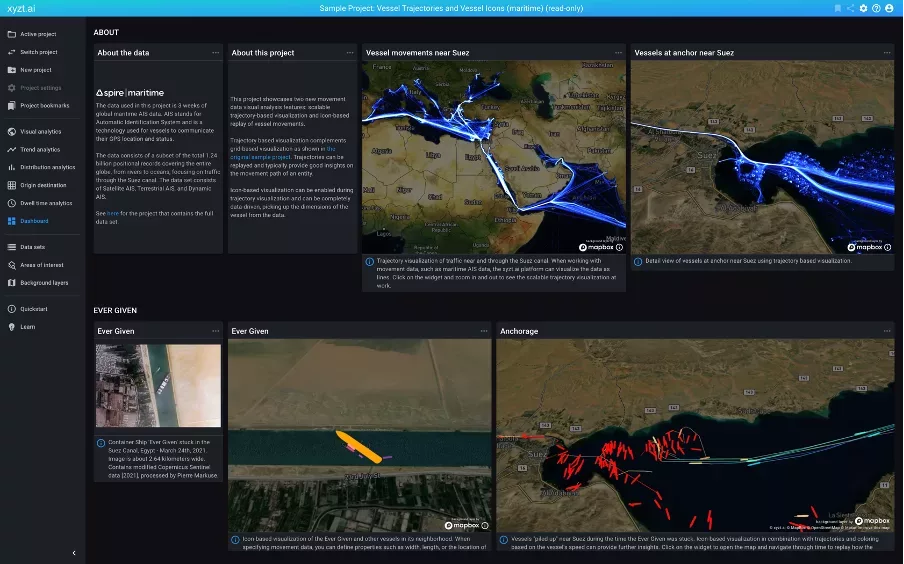
In addition, you can find a new sample project that showcases the benefit of working with trajectories and world-oriented icons here.
USER BENEFIT
For maritime intelligence analysts this provides accurate situational awareness on the movement of the vessels, enabling digital twin-like applications. Also, for aviation, mobility, and other data sets, using oriented icons during data analysis, provides additional insights into the position and movement of aircraft, cars, trucks, etc.
Curious what your data would look like and what new insights you might discover? Try the new features for free and optimize your location analytics capabilities.
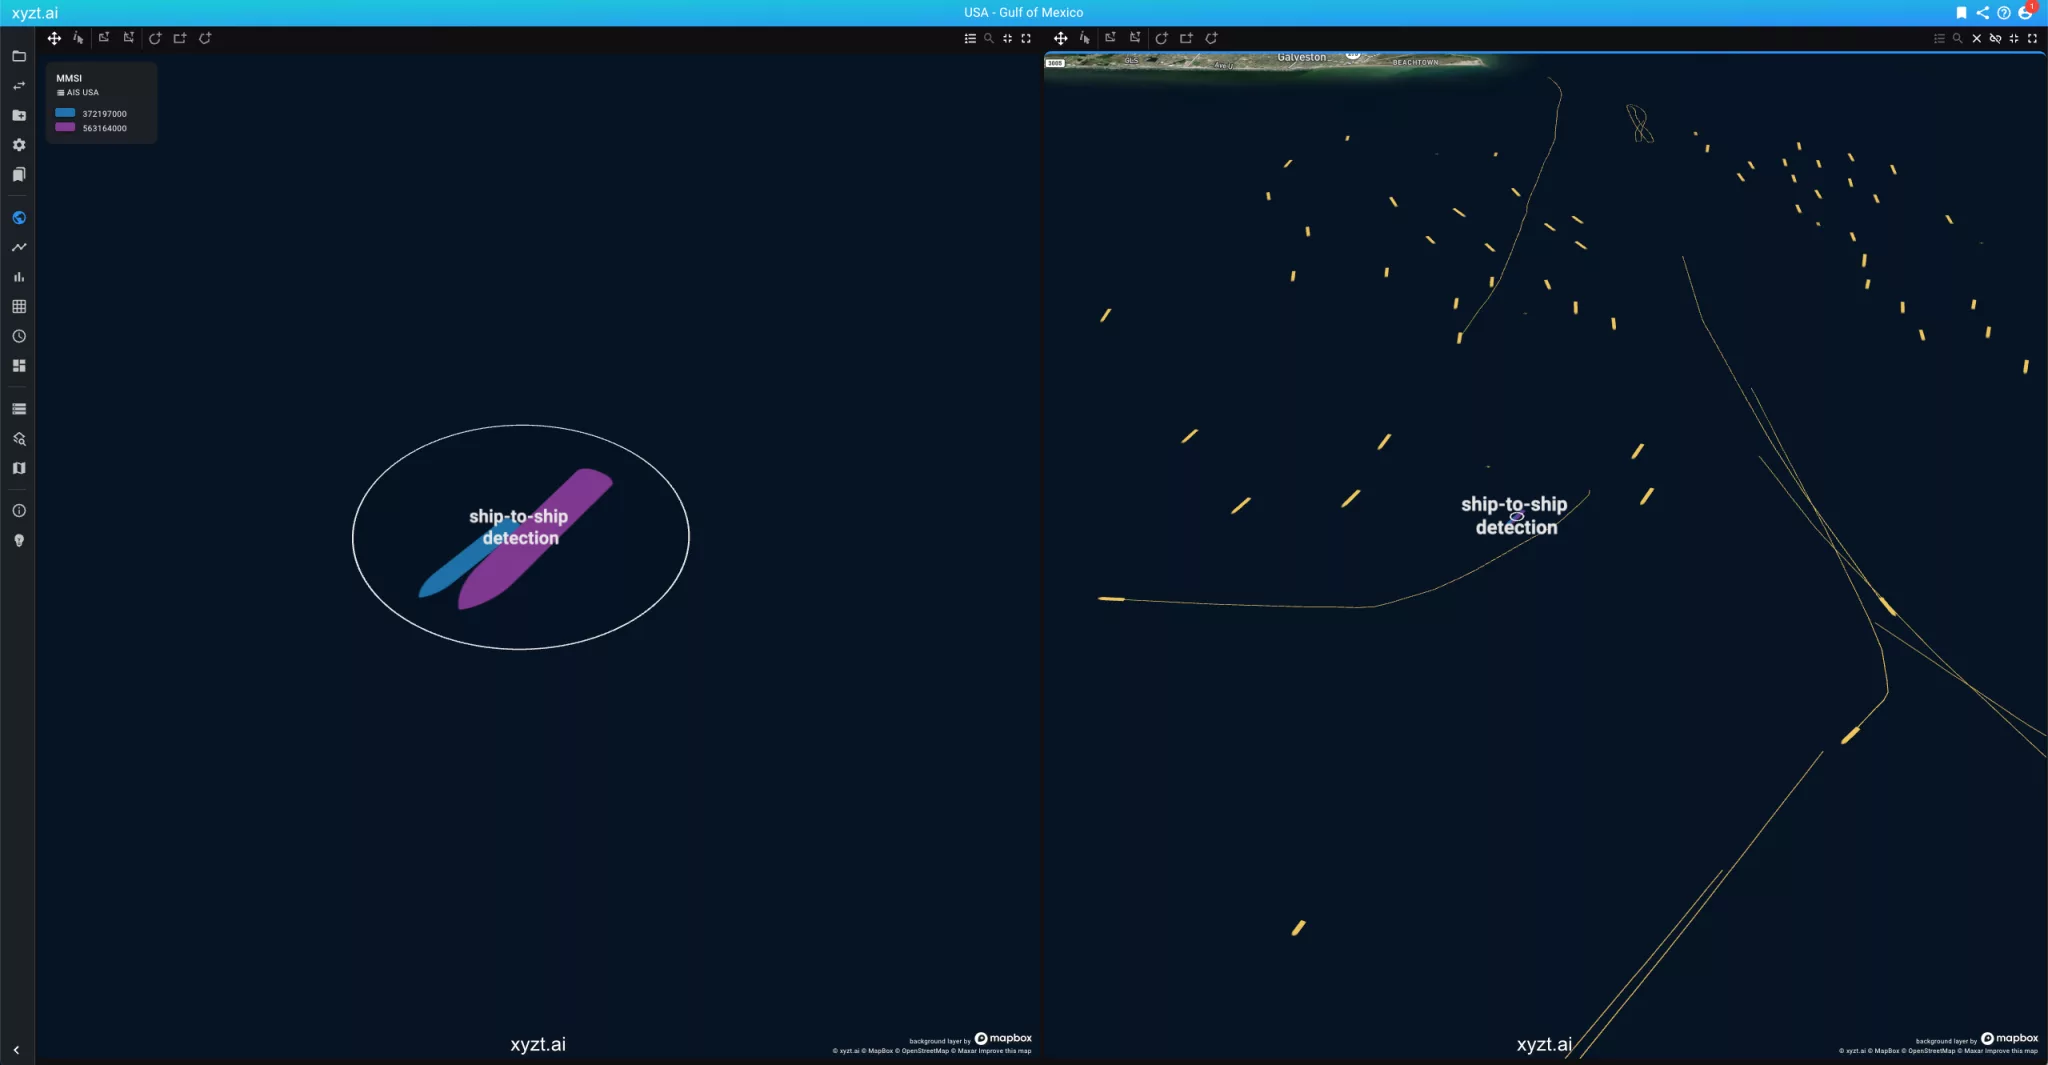
3. Ship-to-ship transfer detection using convoy analytics
We are continuing to extend the platform with advanced space-time analytics.
Convoy detection is the process of identifying groups of entities (2 or more) coming or moving together. In a maritime intelligence context, convoy analysis is used for example for ship-to-ship transfer detection.
Convoy detection is not part of the standard xyzt.ai tiers. Contact us for more information.
USER BENEFIT
Let the xyzt.ai platform find the needle in the haystack and automatically detect and extract important events such as ship-to-ship transfers.
xyzt.ai is a true self-service location analytics platform that aims to make the process of big data visualization and insight extraction as easy as possible. The new feature’s release aims to increase the functionality and interactivity of the platform:
- Multi-scale line-based visualizations and analyses for any data size.
- Accurate visualization of your moving assets using world-sized and world-oriented icons for real-time situational awareness or incident analysis.
- New advanced analytics with convoy detection. To identify important events such as ship-to-ship transfers.