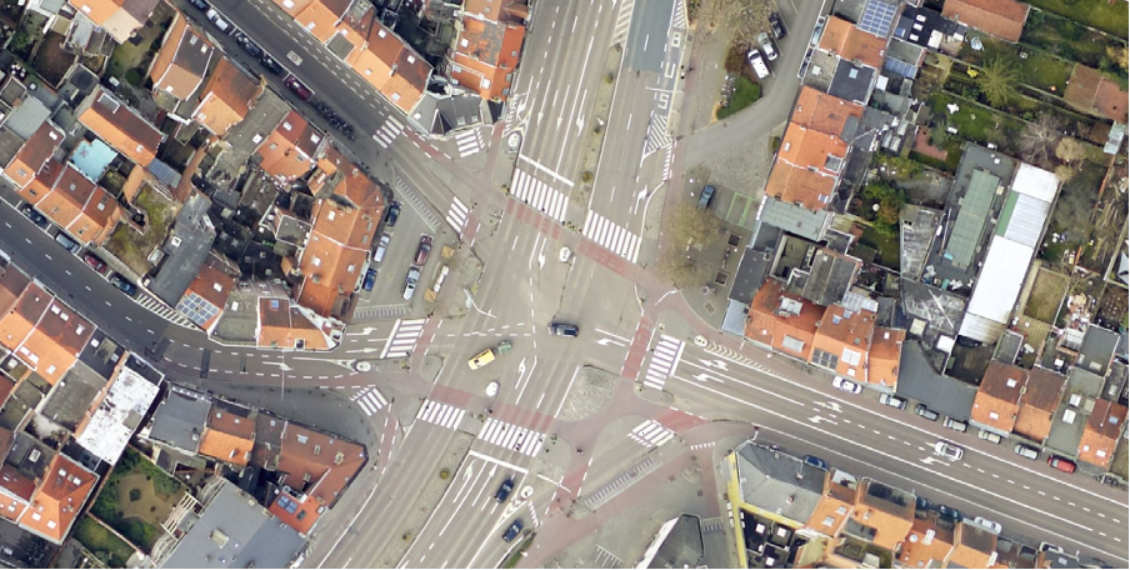
The Tiensepoort Case
This bustling intersection underwent significant changes, including the removal of shortcuts and the introduction of an all-way green signal for pedestrians and cyclists. Contrary to expectations, these alterations resulted in worsened traffic flow, leading to public frustration and extended delays.
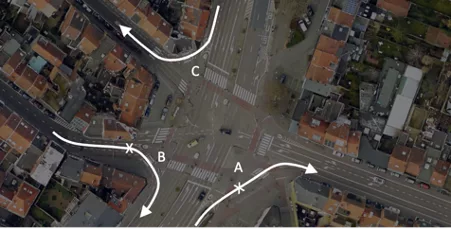
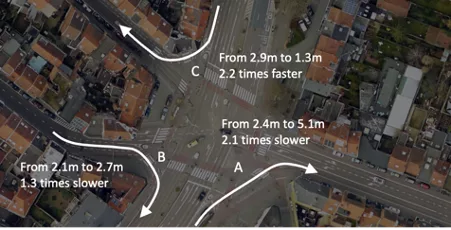
Shortcuts A and B were removed. For these turns, traffic now must wait for the traffic light. Shortcut C was kept.
The Drone Deployment
To decipher the complexities of the traffic dilemma, the agency turned to drones, launching them during peak commuting hours to capture a bird’s-eye view of the situation.
Do We Really Need Drones?
For motorized traffic flow analysis, the answer is a resounding no. The data required for a comprehensive analysis is readily available through floating vehicle data, a point emphasized by our swift and insightful 30-minute examination. Not only does this outperform the time and effort invested in drone-based data collection, but it also unveils critical details that might otherwise be overlooked.
Lunchtime Revelation
Remarkably, our analysis uncovered that the most critical traffic challenges don’t unfold during traditional commute hours but rather during lunchtime. Despite this crucial insight, the agency opted not to deploy drones during this period.
Unlocking Insights with Floating Vehicle Data
Our analysis spanned two months, comparing traffic conditions before and after the intersection remodel using INRIX’s floating vehicle data. The spatial and temporal insights gained from this data were instrumental in understanding the flow dynamics.
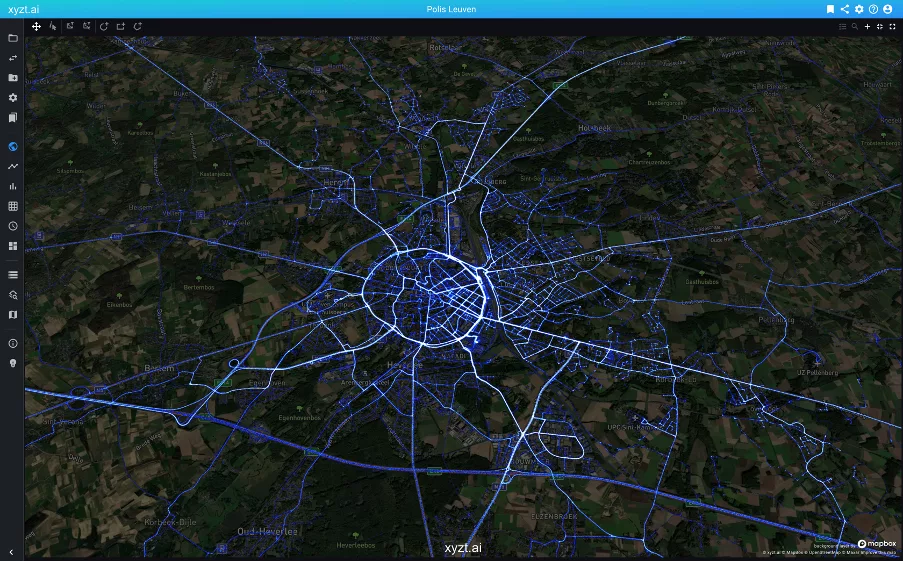
Two months of floating vehicle data from INRIX through the Tienseport intersection in Leuven, Belgium, visualized as a heatmap.
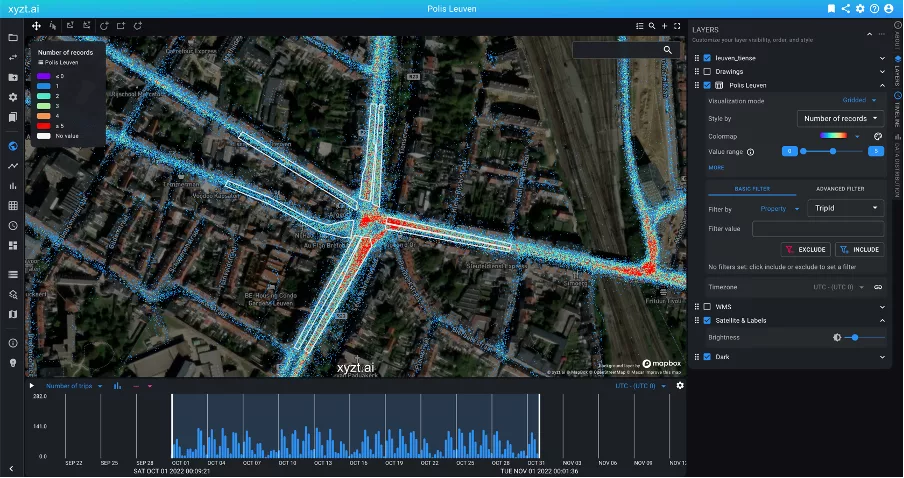
Space time analysis using xyzt.ai and INRIX trips data of the traffic flow at a major intersection in Leuven, Belgium.
As our analysis showed, at certain periods during the day, traffic flows worsened with over a factor 4 in travel time to get across the intersection. And surprisingly, the worst period isn’t the morning or evening commute, but instead lunchtime.
Let’s look at several scenarios.
Traffic Driving North Twice to Four Times Slower
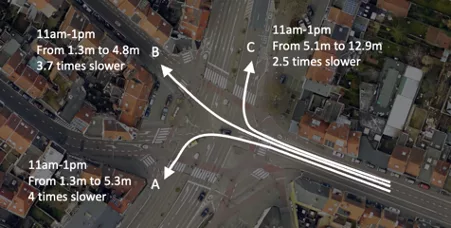
First is our analysis of traffic on the ring road driving north and taking one of 3 possible turns.
Key findings for these traffic directions:
- Over the entire month, traffic turning left or right moves slower on average by a factor 2. For example, for direction A turning towards the main parking Ladeuze, on average, traffic takes now almost 6 minutes compared to 3 minutes before.
- This turning direction sees traffic slowdowns with a factor over x4 during lunch time. From 2.2 minutes before to 9.3 minutes now.
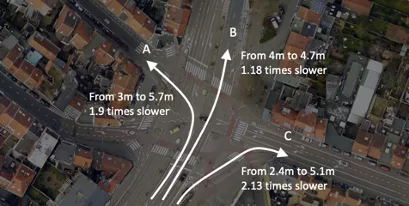
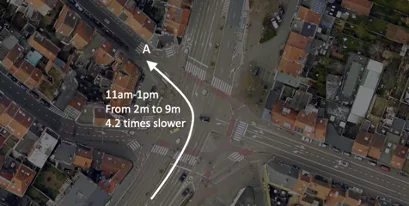
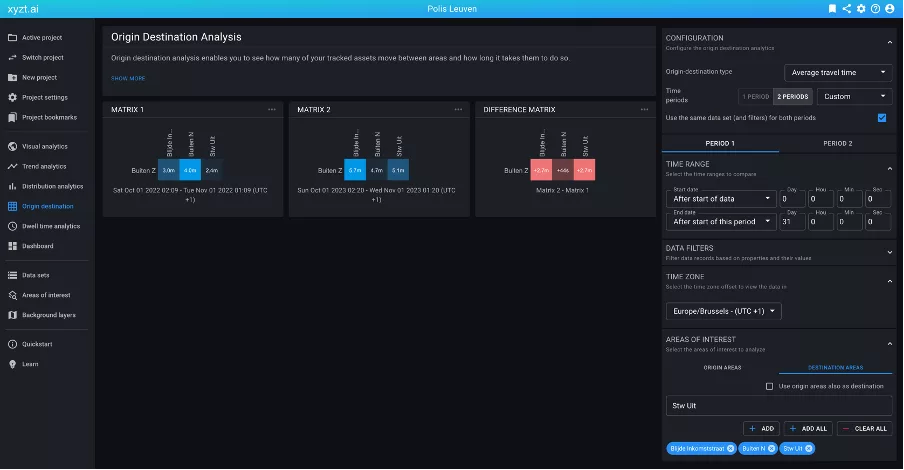
Example travel time analysis in the xyzt.ai platform comparing before and after and change in travel time.
Similar Slowdowns Driving West
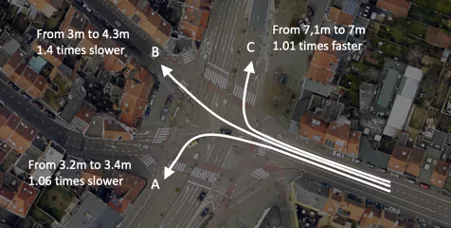
Let’s also look at traffic driving into the city from the east side.
Key findings:
- On average there is only a slight increase and even decrease in travel time.
- However, during lunch time, similar long delays of over a x4 are incurred.
The Remaining Shortcut Wins
We also looked at the effect of removing the shortcuts. Key findings:
- Traffic that could follow shortcut A and B now moves up to twice as slow
- Traffic that can still take advantage of shortcut C, now flows over two times faster
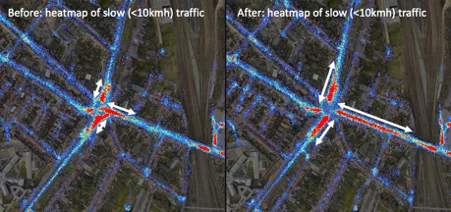
It will not come as a surprise that the queue lengths have increased significantly, as can be seen from following analysis, contrasting a heatmap of floating vehicle data records with a speed below 10kmh, before and after the traffic intersection remodel.
To summarize, let’s look at the key findings and takeaways of this quick analysis.
Key Findings
- Traffic coming from the south turning left or right experiences a slowdown by a factor of two on average, with lunchtime delays soaring over fourfold.
- Traffic entering the city from the east side witnesses only a marginal increase in travel time on average, but lunchtime delays mirror the factor-four trend.
- The removal of shortcuts significantly impacts traffic speed, with vehicles navigating the remaining shortcut experiencing a twofold increase in speed.
Key Takeaways
- Drones are unnecessary for traffic analysis; floating vehicle data provides quicker, more accessible insights.
- Comprehensive data collection, including all hours of the day, is crucial for a holistic understanding of traffic dynamics.
- An intuitive tool for spatial and temporal analysis, like xyzt.ai, transforms raw data into actionable insights.
Return on investment
The return on investment (ROI) of using data-driven analyses based on floating vehicle data is enormous. Knowing that deploying drones to collect data has a significant cost in man-hours and that the cost of installing and maintaining measurement infrastructure can reach up to 1M EUR per kilometer, a data-driven software solution like xyzt.ai is easily 10 to 100 times more efficient.
Conclusion
In the quest for optimizing traffic management, governments and traffic organizations are increasingly looking at innovative solutions. Drones can certainly play a role in this. However, we must not lose sight of the fact that a lot of data is readily available that can be utilized more easily, cost-effectively, and quickly. One such source is floating vehicle data.
Do drones add any value, then? Certainly! Drones can also map non-connected traffic, such as pedestrians and cyclists, and detect (almost) incidents between, for example, cyclists and motorists. However, for in-depth traffic flow analyses spanning long periods, floating vehicle data remains the best alternative to quickly gain insights.
Empowered by the interactive space-time analytics capabilities of the xyzt.ai platform, esteemed INRIX customers, including Autobahn GmbH, City of Hamburg, City of Aachen, State of North Rhine-Westphalia, Texas Road Authorities and others, are now able to effortlessly derive profound insights- akin to those highlighted above - from INRIX floating vehicle data at the speed of thought. The era of cumbersome infrastructure investments is now a thing of the past.
Want more information? Visit our website or book a demo!
