Competition is fierce, obtaining the edge is key
The ship building and ship operating industries are in rough water and are facing a decade of challenges. Think about the increased globalization and the fierce competition from, for example, the Chinese shipbuilding industry. Or the zero emissions agenda. The lack of good quality personnel. Or the reclaiming of the Arctic ocean. Also then there are the many challenges related to the logistics chain with long wait times at ports and terminals.
These challenges put pressure on the industry on the one hand, but also drive innovation through the need to adopt new technologies and processes to increase efficiency. Increased digitization, connectivity (IoT), digital twins, autonomous operations, space-based monitoring and tracking,…
As we will show in this whitepaper, a common denominator between all these technological advances is the generation of data. Spatio-temporal data. Data from IoT sensors on board of a vessel, data from sensing the environment such as ocean wave data, environmental data,…
To remain competitive, existing ship builders and operators have to change their course fast and move full throttle ahead with innovating their engineering, ship building, go-to-market, and operational processes. This includes embracing aforementioned new technologies and the ability to work with spatio-temporal data.
However, innovation is often driven by a small team of researchers, engineers, scientists, marketeers, and often takes multiple years if not decades to find its way to market. This team can become a real bottleneck for acceleration. As an example, we have seen companies, with tens of thousands of employees, rely on a small team of only a handful data scientists to work on all the data-related problems brought forward by the different business units. This team becomes the bottleneck.
In this white paper we will focus on how spatio-temporal data and spatio-temporal analytics will play a core role in the ship building and ship operating innovations in the coming decade. IoT and digitization will generate increasingly more spatio-temporal data necessitating the ability to easily extract insights and obtain business intelligence through spatio-temporal analytics. Investing in spatio-temporal analytics throughout the organization can accelerate ship builders and ship owners to a 10x-100x ROI. To enable self-service insight extraction by any scientist, engineer, marketeer, manager, and avoiding the typical data-science bottleneck.
Spatio-temporal analytics is not a well-known topic, as existing tools are poor at doing so. Spatio-temporal means (1) that the data has a spatial component, i.e., it is data about something that is located somewhere on earth, and a (2) temporal component, i.e., it is data about something that happened at some moment in time. Analytics then means that insights are extracted from this data.
There are two categories of existing tools for insight generation. First, there are Business Intelligence tools such as PowerBI and Tableau. However, they are poor at handling the spatial component and at handling bigger amounts of data, typical for time-varying data. BI tools are however easy to use by any employee in the organization and allow, through self-service, and avoiding the typical data-scientist bottleneck. Secondly, you have Geospatial Information Systems (GIS) tools that (1) require expert knowledge, (2) do not handle the temporal aspect well, and (3) also suffer from scalability when working with larger data sets.
As we will show, GIS and BI are converging in the xyzt.ai visual analytics platform, enabling easy insight generation throughout the organization from spatio-temporal data.
Digitization, IoT, and data-driven insights: what is possible today
Tremendous technological investments have been made to come where we are. To give one example: the maritime Automatic Identification System (AIS). A simple solution for collision avoidance and vessel tracking, now enables global maritime domain awareness through the tracking using nano-satellites, the downlinking and the delivery through cloud-based Data-as-a-Service (DaaS) solutions. Location data from vessels becomes available to not just the vessel tracking operator, but for example also to any financial analyst building models to predict tomorrow’s crude oil prices. This is all possible through investments and advancements made in the space, telecom, IT, and maritime industries.
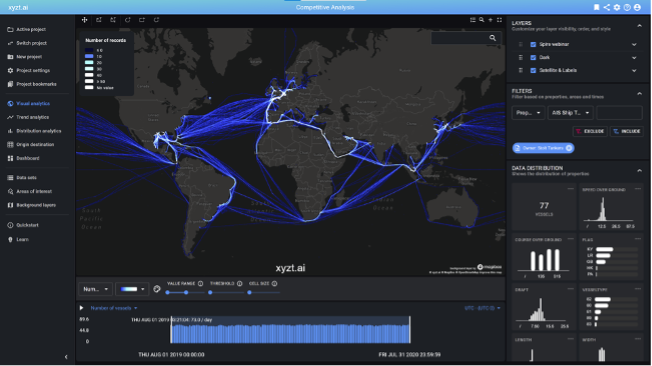
One year of vessel movements of chemical tankers owned by Stolt Tankers. AIS data provides tremendous opportunities for competitive analysis in space and time.
This digitization does not stop at tracking the location of vessels. Sensors now continuously monitor the status of the vessels, including the temperature of the engines, the roll, the accelerations, etc. As vessels get increasingly more connected, this data can now be streamed and collected in near real-time, for monitoring and analysis. Generating huge amounts of time-series data that is now also spatially referenced.
Our environment, weather, atmosphere, ocean,… are continuously monitored by satellites and the data is now readily available through open data programs such as Copernicus. The data is there and provides insights we could not obtain before. Think about climate change and how it affects oceans, wave heights and wave periods, obsoleting old textbooks with outdated tables. Or how climate change affects the Arctic region, introducing not only new shipping routes, but also the development of new types of vessels being able to shortcut through the Arctic areas. Spatio-temporal data on the environment is available, you just need the tools to use it to your advantage.
The business cases for spatio-temporal business intelligence
In this whitepaper we highlight 5 business cases for vessel builders and operators to start using spatio-temporal business intelligence to their advantage: to gain a competitive edge, to innovate, to address new markets, to increase margins,…
The business cases we highlight are:
- Vessel status monitoring (for operations, engineering)
- Vessel activity monitoring (for operations, for commercial)
- Global and Local Fleet monitoring (for operations, for commercial)
- Ocean wave analysis (for operations, engineering, for commercial)
- Competitive analysis (for operations, for commercial)
There are many more business cases for adding spatio-temporal business intelligence to your organization, such as environmental monitoring and analysis, incident analysis, operator training, and many more.
Let’s detail the 5 business cases for using spatio-temporal analytics for vessel builders and operators.
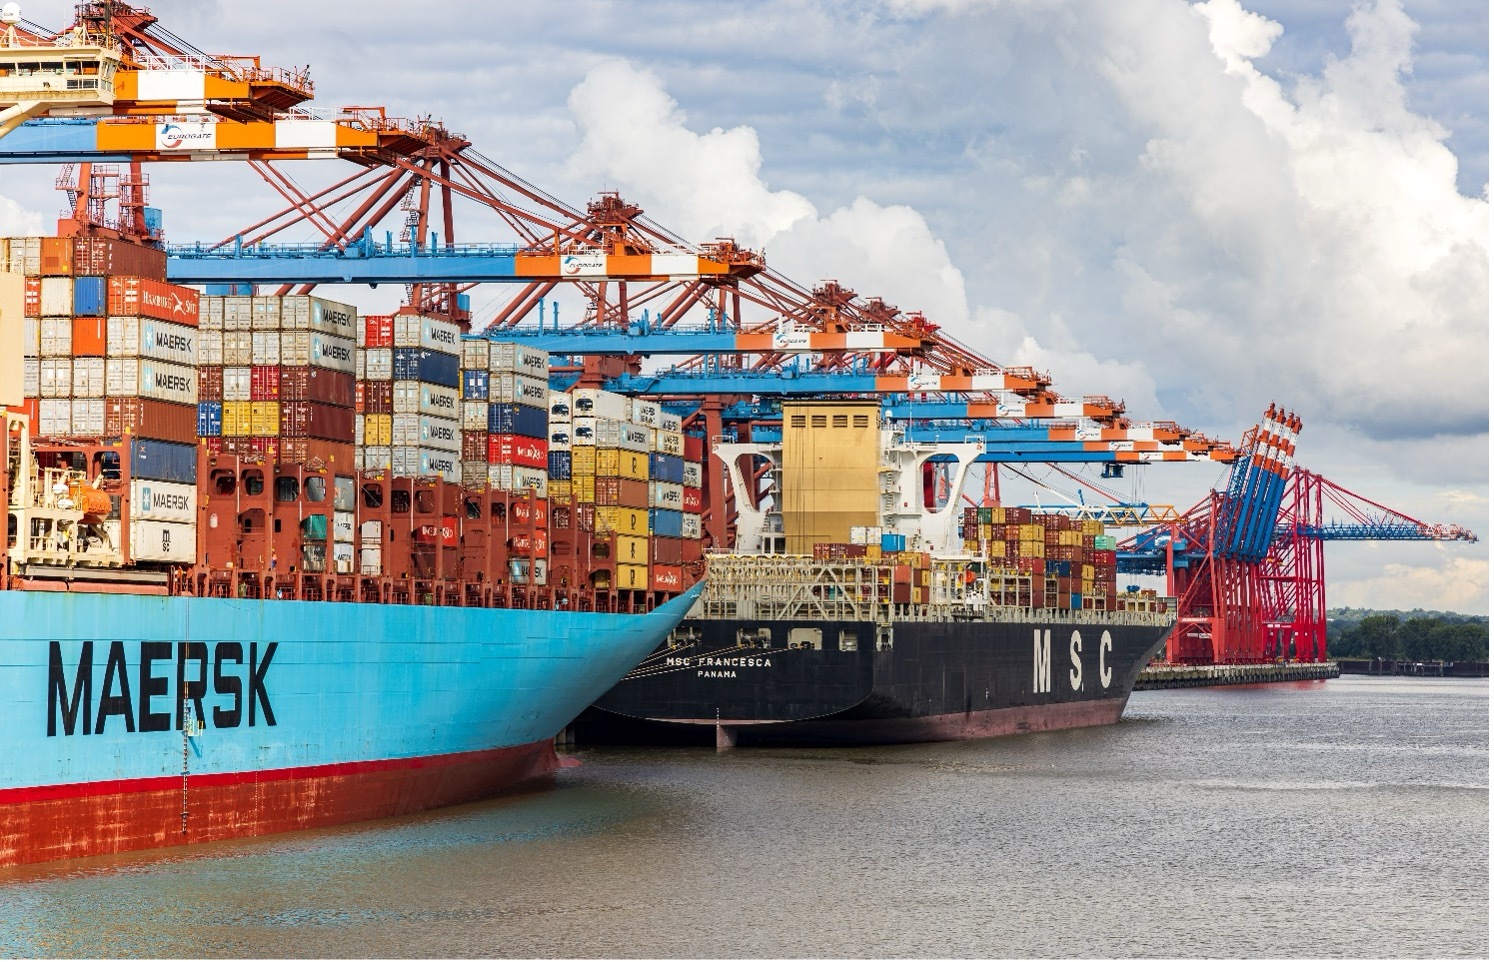
Vessel builders and operators are faced with a fierce competitive landscape. Data-driven insight generation is fueling different business cases from monitoring own fleets and those of the competitor to better understanding the changing environment vessels are operated in. In this whitepaper we highlight 5 business cases for exploiting maritime data and leveraging spatio-temporal analytics for improving operations and increasing profits.
Business case 1: Vessel status monitoring
What?
Monitor the status, including the location, velocity, and any other operational metric of your vessel.
For who?
For operations and engineering.
Using what data sources?
Using AIS data, IoT sensor data, and environmental data such as ocean wave heights and periods.
Why?
Monitoring and logging all sensor data, including the vessel’s location, velocity, 3-dimensional accelerations, engine temperature, status, etc. can provide opportunities for insight generation that both the operational business unit as well as the engineering business units can leverage.
For operational it provides insights into how vessels are operated. Through rough weather. Near offshore wind mill parks. It provides insights into (fuel) efficiency, safety, as well as insights into the usage patterns by different crew.
For engineering it provides intelligence into how vessels perform under various conditions. Do they behave as expected? Are vessels maybe over-engineered? Is maintenance due? How’s the lifespan affected by the different operating conditions? These learnings can drive changes and optimizations and increase profits.
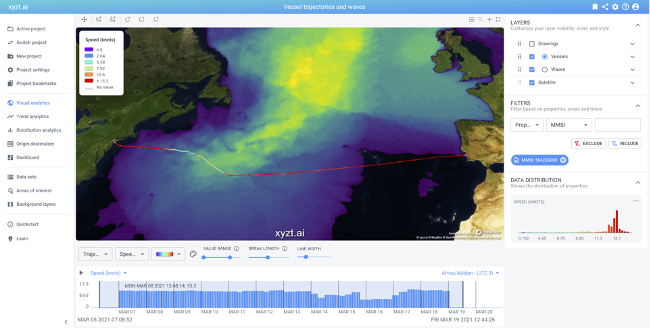
Analyzing a cross-Atlantic vessel journey correlating vessel velocity with ocean wave height data. Data sources: vessel journey from Spire and ocean wave height data from Copernicus.
Business case 2: Vessel activity monitoring, e.g., dredging
What?
Monitor the activity of a vessel, the locations visited, the tasks completed.
For who?
For operations and commercial.
Using what data sources?
Using AIS data, and on-board sensor/measurement data.
Why?
Let’s use the example of dredging as in the picture below. Here you see a density map of the areas visited in port of Antwerp by the trailing suction hopper dredger, the Pallieter, performing maintenance dredging and deepening of the navigation channel of the River Scheldt, in the Port of Antwerp area. (https://www.deme-group.com/projects/maintenance-dredging-river-scheldt).
Dredging operators can keep track of the locations visited, the amount of sand moved, and the depth of the waters. This information and the data is highly spatio-temporal and operators should track, log, and use this data for efficient operations. In addition, the data can be used by the commercial department, for invoicing and reporting.
This is just one example of where a vessel operator can leverage spatio-temporal data and analytics for its core activity.
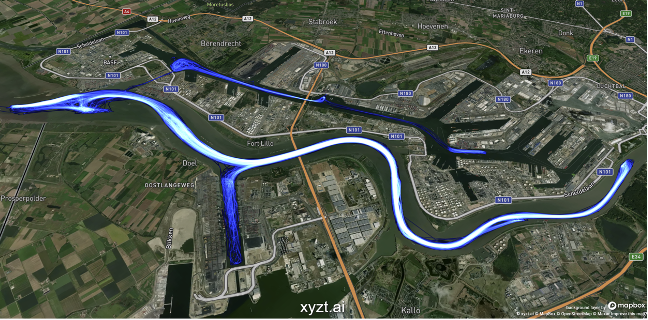
Areas visited during a 6-month period by the dredger Pallieter in the Port of Antwerp area. Areas visited many times are color-coded in white, areas visited few times in dark blue.
Business case 3: Global and Local Fleet monitoring
What?
Monitor the activity of a group of vessels, locally, for example in a port or terminal, or globally, for example between different international ports.
For who?
For operations and commercial.
Using what data sources?
Using AIS data, and possibly own GPS or IoT data.
Why?
Vessel operators keep track of their fleet, in real-time, to monitor operations. Also logging and storing this data about the whereabouts and activities of their fleet, can provide insights into the global fleet operations.
This is even more so important now that the shipping industry has a growing appetite for ship leasing, as opposed to debt and financing transactions. This means that the lessor provides the vessel to the lessee, with all benefits, but also subject to the risks and contractual obligations of operating the vessels correctly and in allowed (environmental) circumstances.
Spatio-temporal analytics will provide valuable information to the ship owner on the whereabouts and status of the vessels.
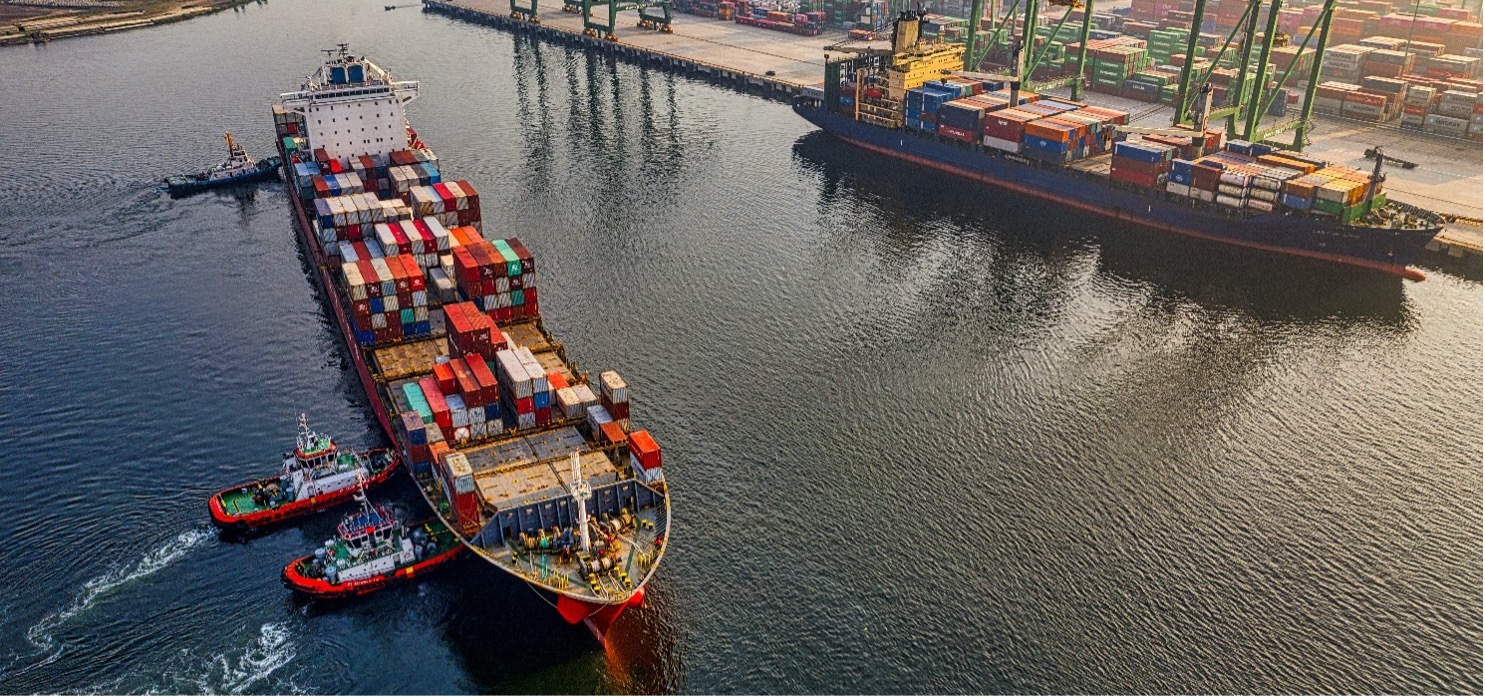
Vessel leasing has become increasingly popular, especially driven by Chinese players such as CSSC Shipping, which reached a vessel portfolio of 136 vessels in 2020 under operational and financial lease. Monitoring usage of vessels under lease can be done using spatio-temporal business intelligence tools.
Business case 4: Ocean wave analysis
What?
Analyze the oceans to better understand the (changing) environment vessels will be sold and operated in.
For who?
For engineering, operations, and commercial.
Using what data sources?
Using remote sensing data such as Copernicus’ ocean wave data.
Why?
Our environment is changing. This includes our oceans. Wave heights and wave periods documented in text books and used by engineering departments for creating structural specifications and designs are outdated. Vessels will potentially be over-engineered. Ice is melting, changing the Arctic regions year over year.
The data is there and can be downloaded with the click of a mouse. Think about the Copernicus Marine Service where hourly updates on the global ocean status can be obtained through a Data-as-a-Service platform.
However, the data is huge, and looking at a single (temporal) snapshot does not provide much sensible insights. Instead, one should look at longer time periods, at identifying and changing trends, and using percentile-based analysis to understand the ocean and its behavior. Are high waves occurring frequently? Are smaller waves with shorter periods occurring frequently?
Engineering can use this information to better dimension vessels for different conditions. To avoid over-engineering. Operational departments can use ocean wave data to monitor whether vessels are used under the prescribed conditions. And the commercial department can use the obtained information to maybe address new markets in regions which previously were deemed not feasible for certain types of vessels.
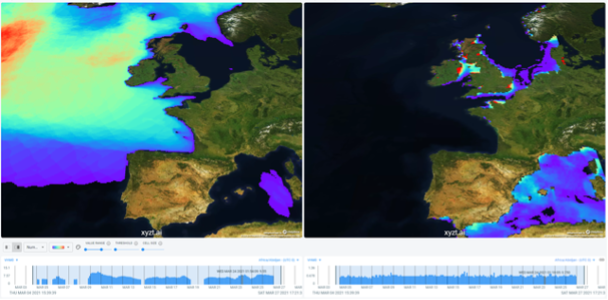
Three weeks of ocean wave data from Copernicus. Left: analyzing areas with extended observations of high waves. Right: analyzing areas with extended observations of small/short period waves. Both can be problematic for operating vessels.
Business case 5: Competitive insights
What?
Analyze your competitor.
For who?
For operations and commercial.
Using what data sources?
Using AIS data and remote sensing data such as Copernicus’ ocean wave data.
Why?
Being more efficient than your competitor means that you obtain larger margins and can grow your business faster. Competitive analysis is an extremely powerful business tool, especially in the maritime domain, where data on your competitor is readily available in the form of AIS vessel data.
Where and when does your competitor operate? What does their operational fleet look like. How does it evolve? Under what conditions? With which type of vessels? How fast do they cruise? Do they navigate through the Suez canal or do they go round the South Africa? Which terminals do they operate in? How long do they spend on average in the anchorage zones?
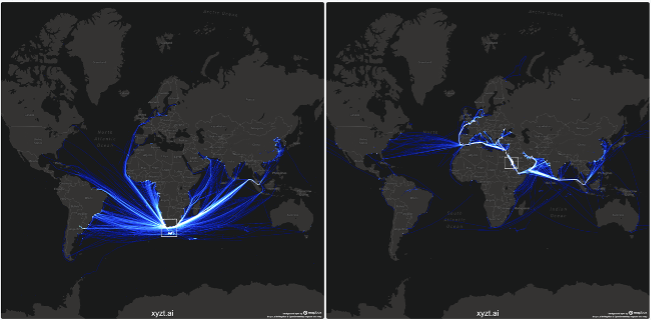
Analyzing vessel traffic passing along South Africa versus through the Suez canal. Monitoring and analyzing your competitor can provide insights such as whether they follow a longer route or a shorter route. Or whether they cruise at lower or higher speeds.
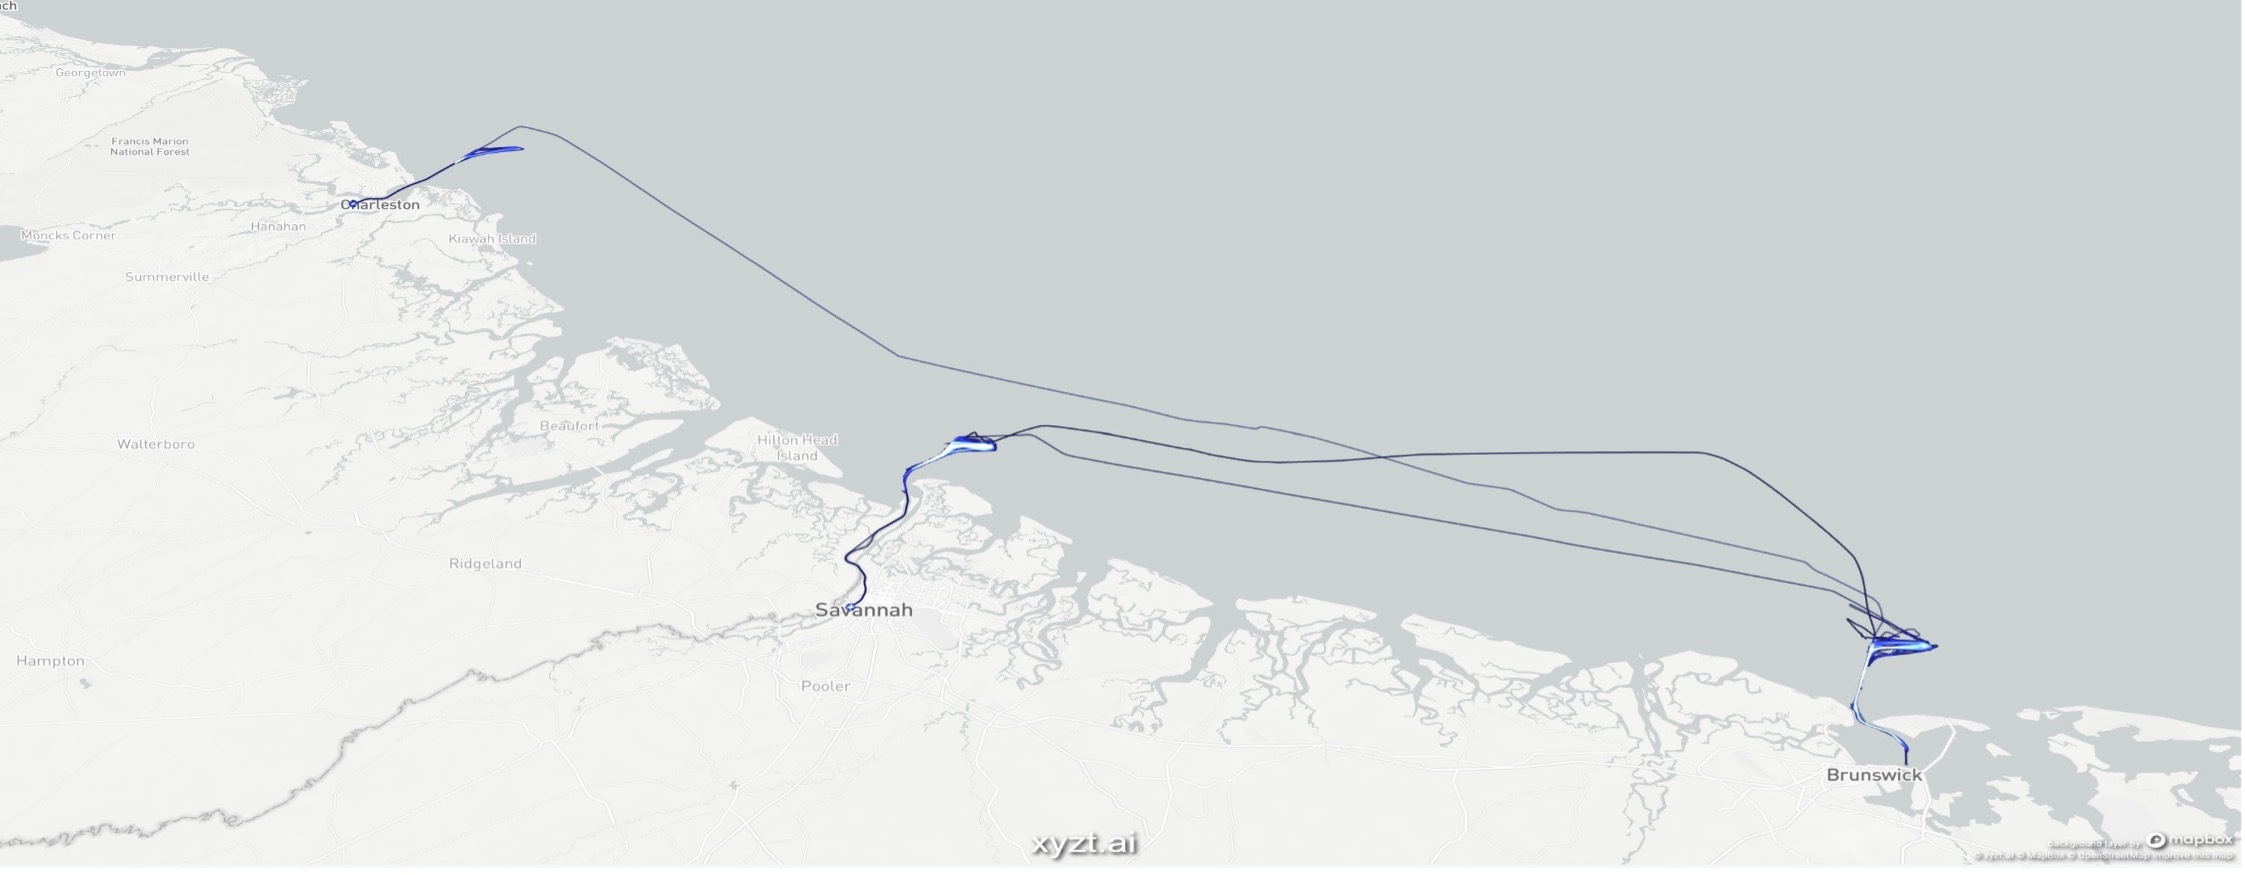
Analyzing the operations of your competitor, including for example looking at the types of vessels, the weather and ocean conditions they are operated in and the frequency and times of operations. In this case looking at operations from dredging vessels to know when and where your competitor is active.
Accelerating to a 10x-100x return on investment
Investing in IoT, sensors, connectivity, and data storage can sound like a big effort. However, many of the investments are already done, for example to track your fleet in real-time. Storing and using the data is then only a small step.
In addition, global data from external sources has now become available and affordable. Think of AIS data that can be purchased for the region and period required, from DaaS companies such as Spire Maritime. Or think about ocean wave data, that is freely available through the Copernicus program.
With a small additional investment, about the quarter (!) the cost of a single employee, you can start exploiting this data throughout the organization. The business cases are plenty and this investment will be easily recovered tenfold or hundredfold.
Let us help you obtain the competitive edge
xyzt.ai is a disruptive spatio-temporal business intelligence tool. It is self-service and bring your own data. No costly and long custom data processing or algorithm engineering. Simply ingest the data in the platform, and let it take care of storing, compressing, and making the data available in an interactive easy-to-use way, for any user in the organization.
Perform your own analysis, build dashboards, and share your insights with your colleagues and your customers. Avoid your data science team to become the bottleneck and start leveraging spatio-temporal business intelligence in your different business units, including in operations, engineering, and the commercial departments.
You can find us at www.xyzt.ai or contact us at [email protected] for more information or a live demo.
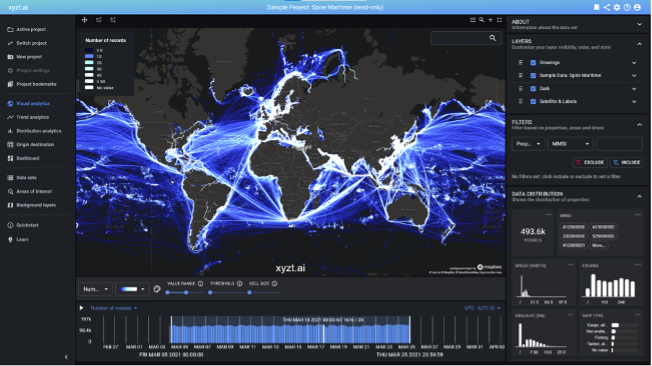
The xyzt.ai platform, a big data spatio-temporal business intelligence platform, with maritime AIS data from Spire.
