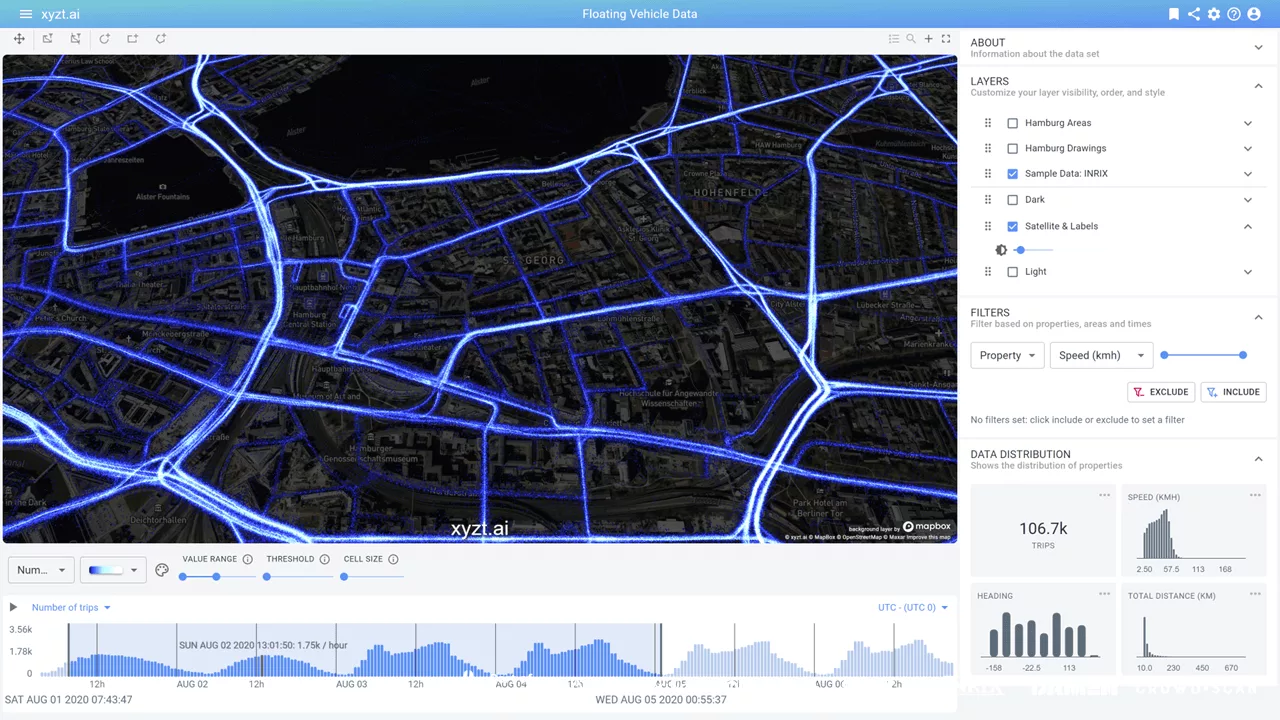
Just think of the many new ways to measure traffic and urban mobility. They now range from conventional traffic counters, license plate recognition, and CCTV cameras to floating car data obtained from connected vehicles and privacy-preserving crowdsensing sensors.
This is creating immense opportunities to understand the real-time and historical urban mobility situation and its evolution. Both within city centers and the surrounding areas. Given the importance of sustainability and safety in public policy today, cities need to be in control and leverage these new and alternative data sources.
Urban mobility data visualization
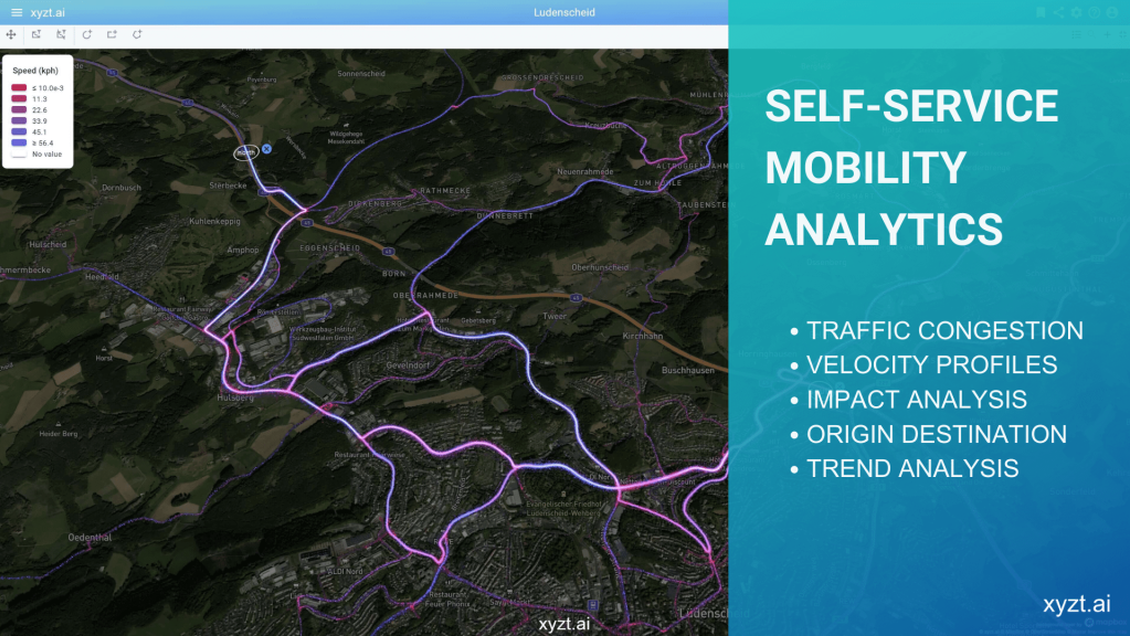
To demonstrate how you can approach urban mobility analysis, we have visualized floating car data with mobility analytics software. Traffic diverted from the closed A45 motorway in Germany is causing a major obstruction in the German town of Lüdenscheid. As you can see in the picture above, the heatmap shows northbound motorway traffic that has been rerouted through the town center. Blue represents faster traffic and pink slower traffic.
Register here to rewatch our on-demand webinar with leading mobility data provider INRIX, in which we explain the Lüdenscheid use case and how to perform self-service mobility analytics.
However, quickly extracting mobility insights from big data is no easy task if you don’t have the right tool. While large cities can invest in a specialized team of data scientist to do the number crunching, this is beyond the financial reach for medium-sized and small cities. Even if the municipal administration has a data science team, it can take months to integrate a new data source and answer the questions of the press and policy makers.
Using a self-service mobility analytics platform, anyone can start putting their data to work and time to insights can be reduced from months to minutes.
Self-service analytics for urban mobility insights

xyzt.ai‘s mobility software is a self-service analytics and reporting tool made for cities to easily leverage any spatio-temporal mobility data, such as floating car data or people flow data.
The analytics platform handles any urban mobility data that has a geospatial component (where) and a temporal component (when). Any other attributes, such as velocity, acceleration, trip length or CO2 emissions, are compiled with these two basic components. Consequently, these attributes help the user understand the urban mobility situation better.
Bring your own mobility data
xyzt.ai’s self-service mobility analytics platform serves as an intuitive power BI tool, but it is specifically designed to handle the many new sources of urban mobility data.
Bring your own data, manage projects with your team independently, and generate analytical mobility reports via the interactive dashboards. The mobility analytics software equips you with the tools you need to visualize, analyze, and report in minutes instead of months. Putting you in control of the mobility situation.

