What Went Wrong?
On Saturday, June 17, 2023, the small village of Werchter kicked off its summer festival season with a day filled with music at the Werchter festival area. The event, called Werchter Boutique, featured a star-studded lineup including Ellie Goulding, OneDirection, and P!nk.
Approximately 45,000 enthusiastic fans made their way to the famous festival grounds of Werchter. However, this year, the arrival and departure by vehicle didn’t go as smoothly as before. Traffic jams plagued the surrounding roads, causing visitors to endure up to 4 hours of gridlock for the last few kilometers until they reached their designated parking areas.
To make matters worse, after the electrifying concerts, people had to endure long queues well into the night just to make it back home.
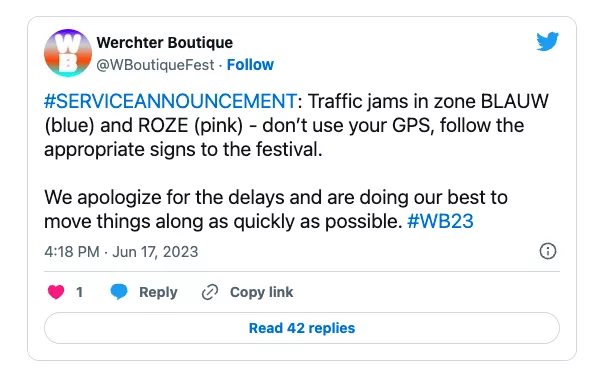
With the main Rock Werchter 2023 festival just around the corner, expecting double the number of visitors each day, we at xyzt.ai seized the opportunity to analyze the traffic situation on June 17, 2023, the day of the Werchter Boutique festival. Our analysis was based on anonymized and aggregated floating vehicle data from our mobility data partner, INRIX.
But first, let’s understand a few key terms:
Background Information
What is floating vehicle data?
This data provides insights into the movement of vehicles, helping us understand traffic patterns and trends.
What is the xyzt.ai platform?
Our powerful platform empowers mobility analysts to perform in-depth analyses on various spatio-temporal data, including floating vehicle data.
A Clash of Normalcy and Festivity
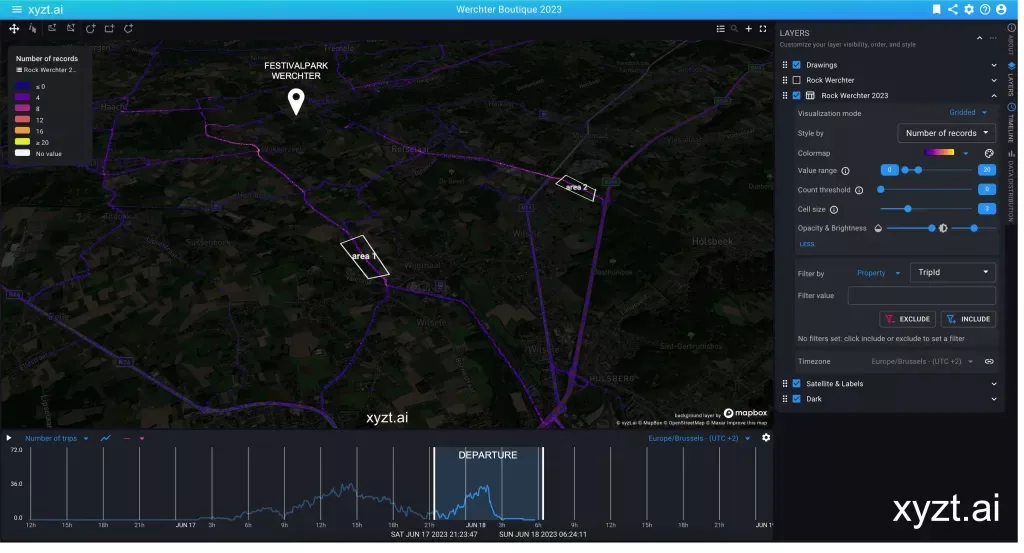
To gain a clearer picture, let’s compare a typical day in the tranquil village of Werchter with a past festival day. We created a shape encompassing the festival area and visualized the traffic passing through using density maps and trend lines.
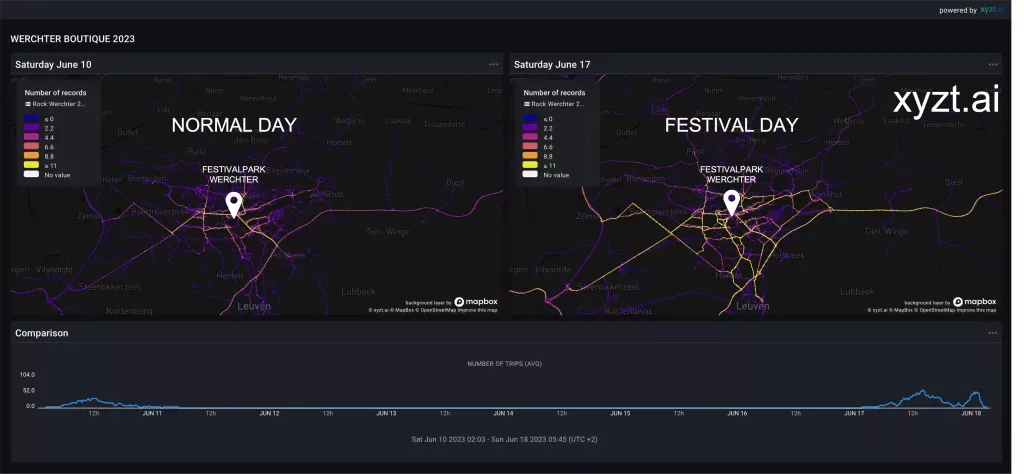
As we delve into the charts, we notice a stark difference on festival days. The density maps show a sea of yellow, indicating heavily congested roads during the event. In contrast, the maps on normal days exhibit less traffic, represented by shades of purple.
Furthermore, the timeline at the bottom reveals an intriguing pattern. On festival days, the number of vehicles experiences a dramatic surge in the afternoon and evening, unlike the steady flow on regular days.
Taking a Deeper Dive
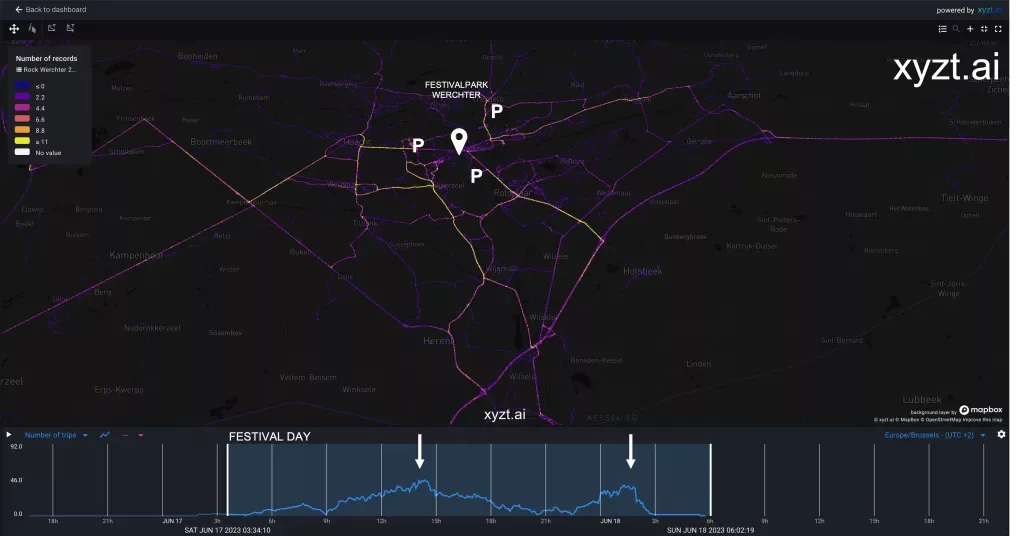
By clicking on the map widget, we are transported to the Visual Analytics page, where mobility analysts can scrutinize the traffic situation further.
Before the festival, we observe a steady increase in traffic starting from 10 am, reaching its peak around 2 pm. After the event, during the night, the highest traffic peak occurs at approximately 1:30 am.
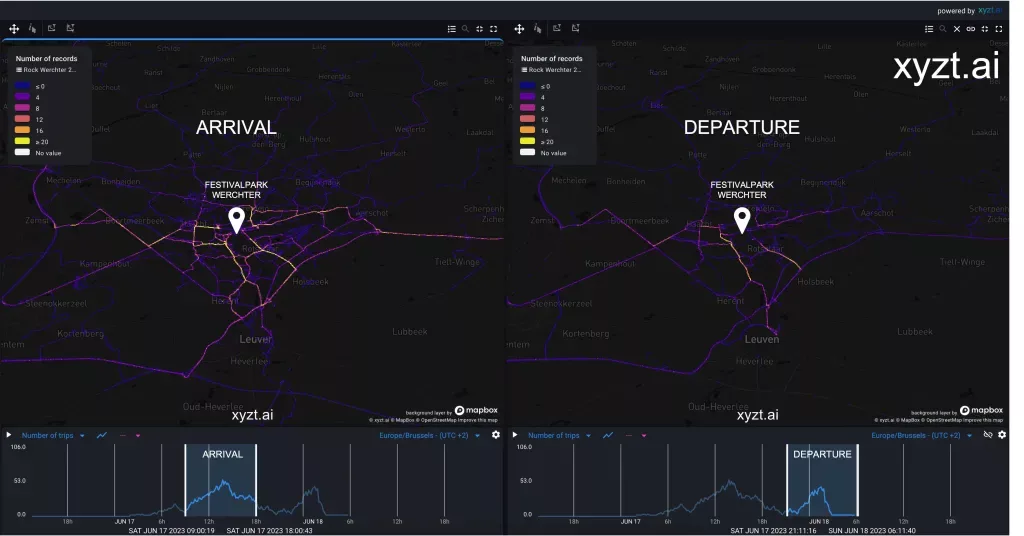
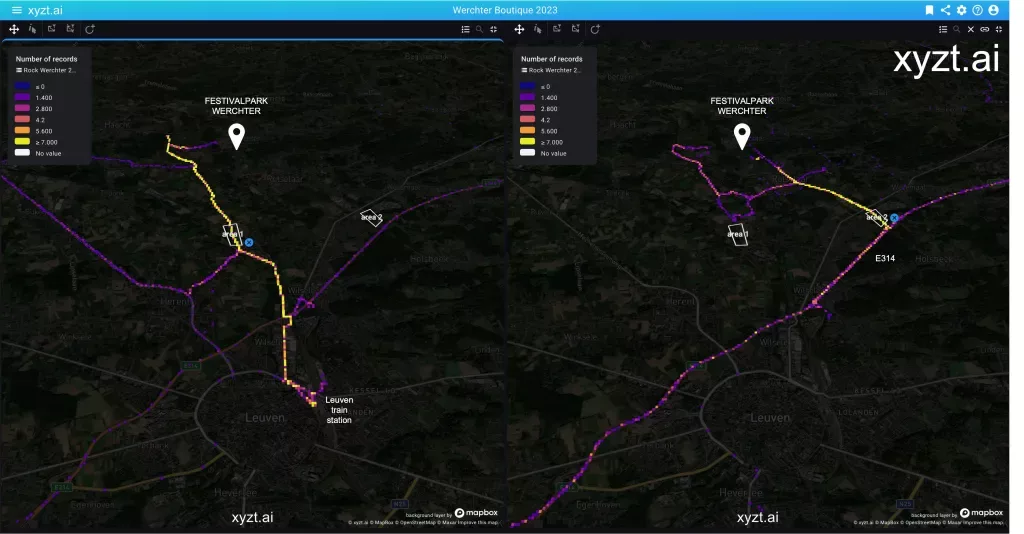
Moving our time range filter to focus on the arriving traffic during the day (image below, left part), we see that traffic density is not only situated on the final legs towards the different parking areas, but also at the exits of the different highways such as the E40 in Zemst, the E314 in Holsbeek, and the E314 in Aarschot.
At night , we see that traffic density is much more localized and mostly on the roads going south towards the E314 and Leuven (image below, right part).
Narrowing Our Focus
To refine our analysis, let’s examine two major roads frequented by drivers leaving the festival site at night. These roads are highlighted in yellow on the right side of the map above.
In the first area, marked as “area1,” we notice a significant influx of traffic from the parking lot west of the festival area, known as The Hive. Most of this traffic heads south toward Leuven, including the buses transporting visitors to the Leuven train station. A smaller portion of traffic veers west immediately after leaving area1.
In the second area, labeled as “area2,” we observe that some drivers attempt to avoid the bottleneck at area1 and end up encountering traffic jams around area2.
Lessons Learned and Future Steps
This preliminary analysis merely scratches the surface of understanding the traffic problems. Floating vehicle data allows us to analyze density maps, trend lines, travel times, origin-destination matrices, and much more.
With the xyzt.ai platform, performing on-demand visual analyses on various spatio-temporal data, including floating vehicle data, becomes incredibly effortless.
Let’s hope the remainder of the festival season unfolds with fewer traffic annoyances and smoother mobility.
Implications for Municipalities and Festival Organizers
Festival organizers and municipalities need not remain in the dark. Data is readily available and can be utilized to better prepare and mitigate problems and inconveniences. Moreover, this data not only sheds light on local conditions surrounding the festival area but also provides insights into where and when festival visitors travel from.
A big thank you to INRIX for providing us with this data set.
To learn more about the xyzt.ai platform, the available data, or to request a customized demo, please get in touch with us.

