A large transportation agency was grappling with the complexity of sharing insights derived from vast datasets. Analysts spent significant time manually preparing reports, taking static screenshots, and compiling findings into presentations or PDFs. This process was not only inefficient but also limited the ability of non-technical stakeholders—including peers, management, and external partners—to fully grasp the findings. The static nature of the reports prevented any interactive exploration or deeper understanding, creating a communication gap and slowing down the decision-making cycle.
Simplifying Data Reporting with Interactive Dashboards
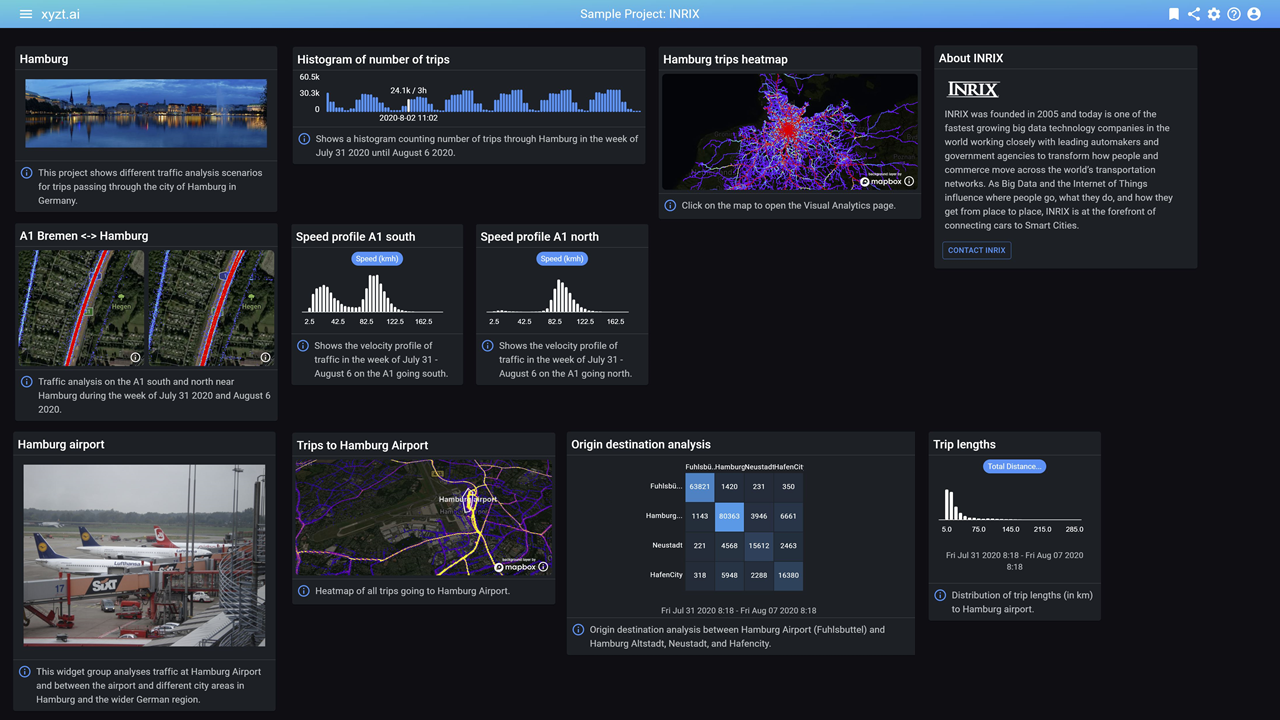
For a major transportation agency, sharing insights from complex data was a slow, manual process. This case study shows how they transformed their reporting by moving from static presentations to interactive dashboards, improving efficiency and communication across the entire organization.

The challenge
The solution
The agency adopted a powerful mobility analytics platform that enabled them to create and share interactive data reports and dashboards with a single click. Instead of relying on static documents, analysts could now construct a compelling "data story" directly within the platform.
The new process allowed them to:
- Create dynamic visualizations: Easily generate heatmaps, charts, and other visual representations of traffic patterns and congestion issues.
- Instantly share insights: With a single click, a special link could be generated to share a complete, interactive view with anyone.
- Facilitate interactive exploration: Recipients could actively engage with the data, zooming in on areas of interest, filtering timelines, and applying other parameters to explore the findings on their own.
Crucially, the platform included robust security features, ensuring that shared views protected the original data while still providing a fully immersive, interactive experience. The ability to deactivate a link at any time provided full control over who could access the insights.
Sharing a dynamic, interactive view with a single click has transformed our process. We're no longer just reporting on data; we're collaborating on it.
Results
By transitioning to an interactive, dashboard-based reporting system, the transportation agency achieved a powerful return on investment in a number of key areas:
- Increased Efficiency: The time spent creating and distributing reports was drastically reduced, allowing analysts to focus on deeper analysis instead of manual report generation.
- Improved Communication: Insights that were once difficult to convey in static reports became immediately understandable and convincing, even to non-technical peers and external stakeholders.
- Accelerated Decision-Making: With a clear and unified understanding of the data, stakeholders could quickly agree on findings and move from discussion to action, leading to faster implementation of traffic and mobility improvements.
If you'd like to know more about how we can help you get the most out of your traffic data, feel free to request a demo.
You might also like:
Improving Time Budget Efficiency with In‑House Mobility & Traffic Analytics