The xyzt.ai platform

Turn complex movement, location, IoT and sensor data into clear visual insights you can explore and share.


xyzt.ai is built to handle large and demanding data sets, helping you uncover patterns and answer questions without developing custom analytics tools.


Upload your own data or connect existing data sources through an API.


Request a free demo

Bring your data together

Upload your movement, location, IoT or sensor data and start exploring it right away. Use drag and drop for a quick start, or connect your existing data sources through an API.

As long as your data includes location, time and other relevant attributes, xyzt.ai helps you bring it together in one place for analysis.

Compare places, periods and patterns

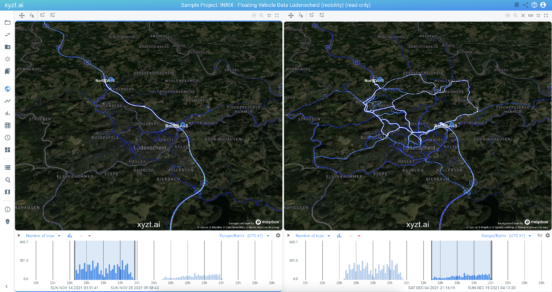
Compare locations, time periods or patterns side by side to quickly spot differences and understand change.

Use two maps and timelines together, synchronize them to compare different periods, or focus each view on a different location. This makes it easy to explore your data from different angles and investigate what has changed, where and when.

Check out our other user benefits

Find the patterns that matter

Explore trends, compare behavior over time and answer specific questions about your data.

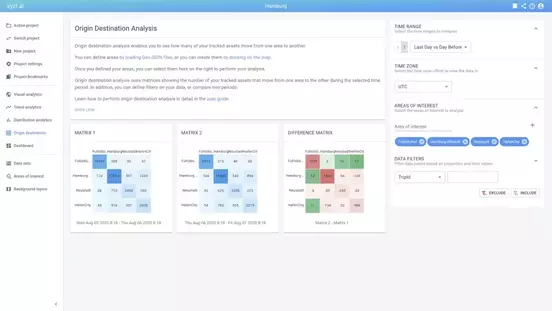
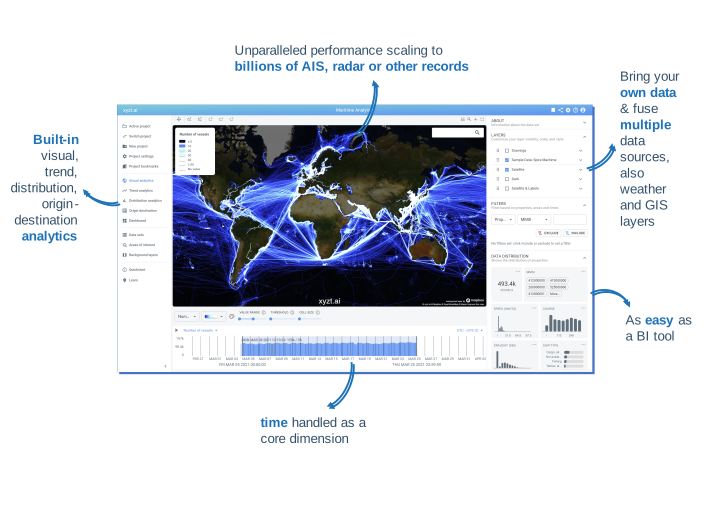
Built-in analytics include origin-destination analysis, dwell and travel times, segmentation, time-of-day analysis and more, helping you move from raw data to useful answers faster.

Tell a story with your data

Turn your analysis into clear, interactive dashboards that make your findings easy to understand and communicate.

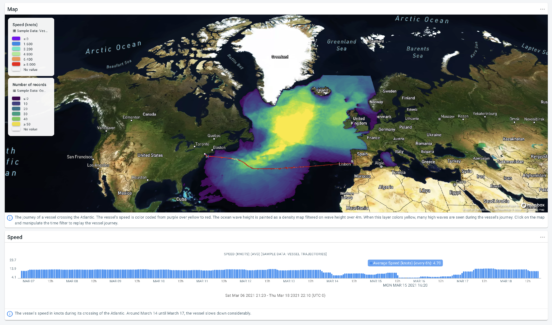
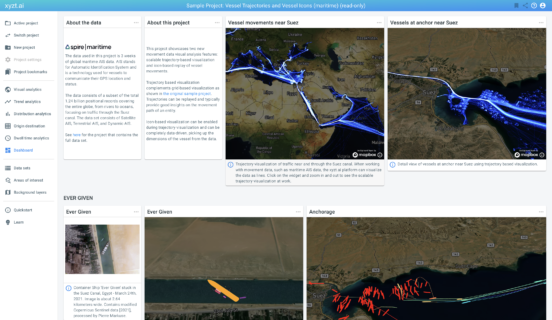
Combine maps, timelines, bar charts and other visualizations to present the insights that matter most to your audience.

Share insights with others

Work together on the same projects and share your analysis directly from the platform.

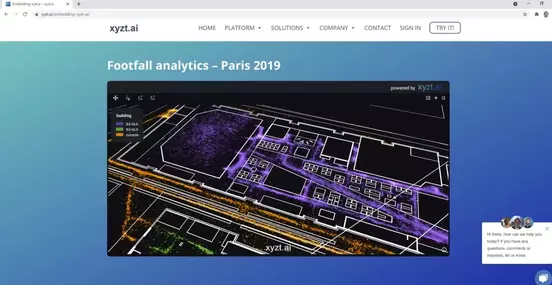
Create links to visualizations and dashboards, or embed interactive maps, charts and dashboards into your own web pages and applications.

Analyze even your largest data sets

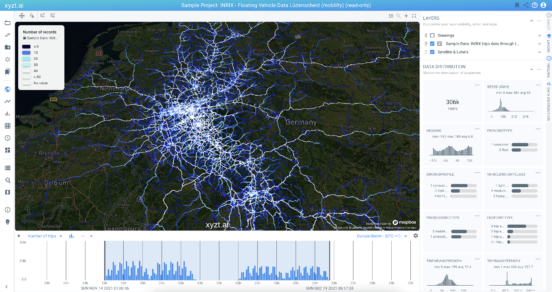
Work interactively with millions or billions of location records without having to reduce your data to small samples or static reports.

xyzt.ai is built to handle very large data volumes while keeping exploration fast and interactive, so you can work with the full picture rather than just a fraction of your data.

Read the article

Add analytics to your own solution

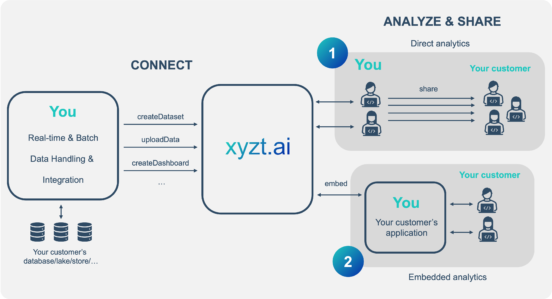
Embed xyzt.ai maps, charts and dashboards into your existing applications and give your customers interactive analytics without building everything from scratch.

Use the REST API and embedding options to integrate xyzt.ai into your existing architecture.

Work wherever you need to

Access your analytics from desktop or mobile and continue exploring your data wherever you are.

Even very large data sets remain interactive across devices, giving you flexibility without compromising on scale.

See it in action

What this means for you