Vessel tracking is useful. But for many maritime teams, knowing where a vessel is right now is only the starting point.
The real value comes from understanding what vessel activity means, how it changes over time, where risks are emerging, and how different data sources can be combined into actionable insight.
That was the focus of our webinar Beyond Vessel Tracking: Maritime Intelligence on Your Data, Your Infrastructure, at Any Scale. In this session, we showed how the xyzt.ai platform helps maritime organizations move from simple vessel visibility to scalable maritime intelligence, using their own data, infrastructure, and workflows.
From real-time AIS monitoring and port intelligence to data quality analysis and dark vessel detection, the webinar demonstrated how space-time analytics can help teams make better decisions from complex maritime data.
What we mean by maritime intelligence
Maritime intelligence goes beyond plotting vessels on a map.
It helps answer more operational and strategic questions, such as:
- What is happening in this port, anchorage, or shipping lane?
- How has vessel activity changed over time?
- Are there abnormal or risky movements?
- Where are vessels slowing down, waiting, or deviating from expected behavior?
- Is our AIS coverage reliable in this region?
- Are there vessels visible in satellite or radar data that are missing from AIS?
- How can we turn this data into dashboards, alerts, reports, or analytics products?
At xyzt.ai, we help teams work with this type of space-time data at scale. Our platform is designed for data that has both a location and a timestamp, including AIS, radar, satellite detections, SAR data, gridded data, nautical layers, and other operational datasets.
The result is a more complete view of maritime activity, one that supports both real-time operations and historical analysis.
From vessel tracking to operational insight
Many maritime platforms focus on showing current vessel positions. That is valuable, but it does not solve the full analytics challenge.
Teams often need to investigate the past, compare time periods, filter by vessel type or region, detect patterns, and share findings with operational or commercial stakeholders.
During the webinar, we showed how xyzt.ai enables users to:
- Ingest real-time or historical vessel data
- Visualize vessel movements and density
- Filter and analyze activity in specific areas
- Build dashboards without coding
- Compare AIS with other data sources
- Identify gaps, anomalies, and unusual behavior
- Deploy analytics in the cloud, on-premises, or in secure environments
Because the platform works with customer data, organizations can bring their own AIS feeds, satellite data, radar data, AI outputs, or internal operational datasets into the same analytics environment.
👉 Interested in watching the full webinar? You can download it here.
Real-time vessel monitoring with historical context
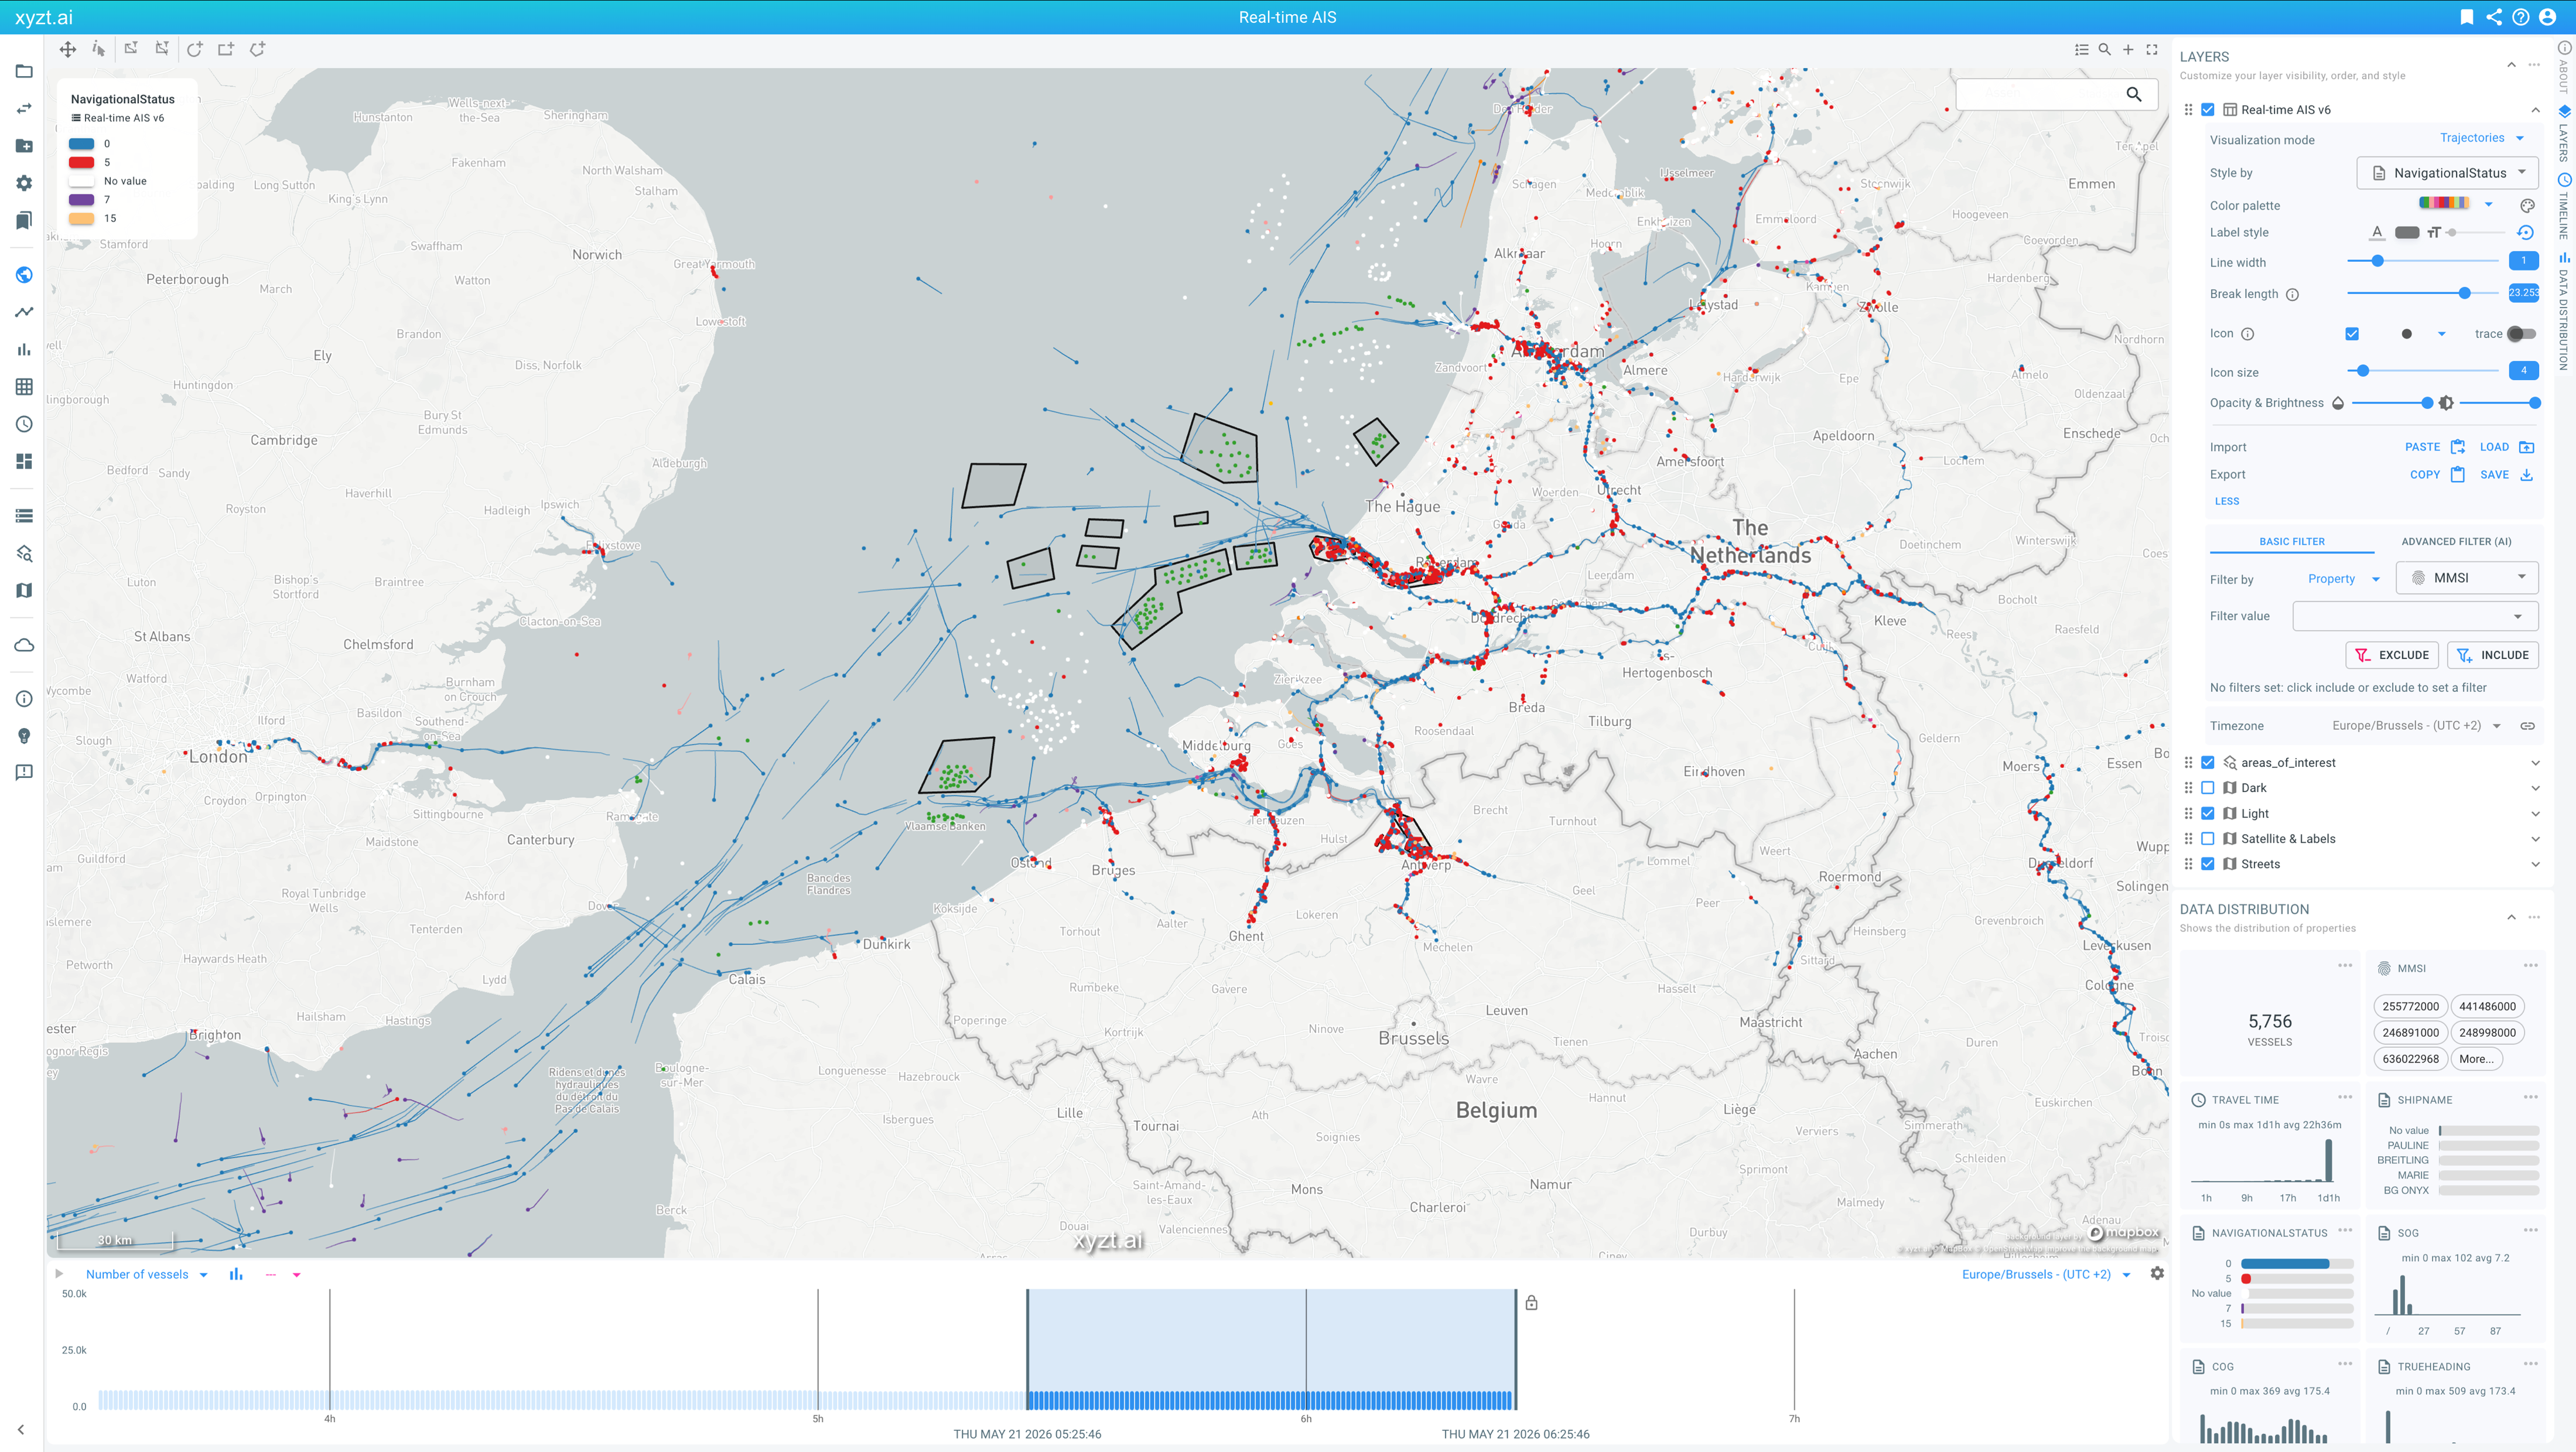
One of the first demonstrations focused on real-time AIS monitoring.
We showed how vessel positions can be pushed into xyzt.ai through our API every few minutes and visualized directly on the platform. Users can see current positions, headings, vessel traces, and recent activity.
But real-time monitoring becomes much more powerful when it is combined with historical context.
With xyzt.ai, users can go back in time, replay vessel movements, inspect previous behavior, and understand what happened before an event. This is especially useful for teams that need to investigate incidents, monitor high-traffic regions, or understand operational changes as they happen.
Instead of only seeing where vessels are now, teams can understand how the situation developed.
Port intelligence for safer and more efficient operations
Ports are among the most complex maritime environments. They bring together dense vessel traffic, narrow maneuvering areas, terminals, jetties, operational constraints, and safety-critical infrastructure.
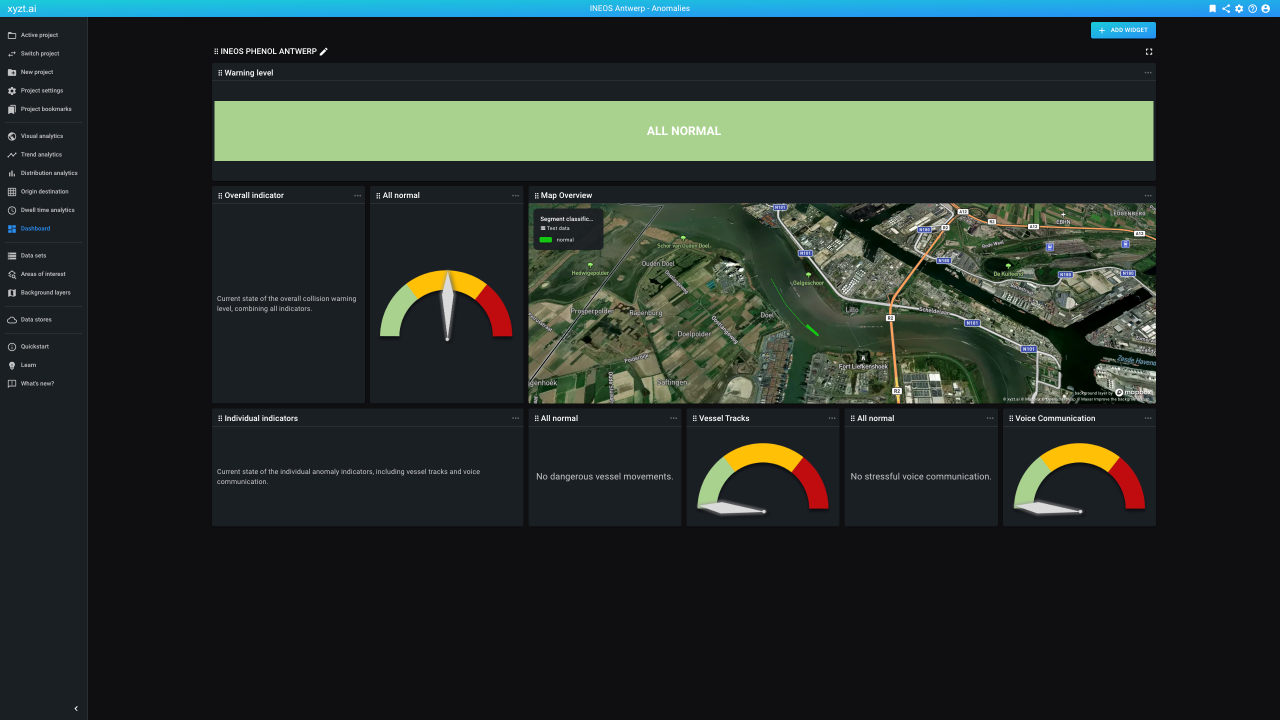
In the webinar, we showed how xyzt.ai can support port intelligence by helping teams analyze vessel behavior in and around port areas.
This included examples such as:
- Detecting abnormal vessel movements
- Monitoring vessel behavior near jetties
- Visualizing traffic density over time
- Analyzing how large vessels maneuver in restricted areas
- Supporting operational awareness and safety workflows
One example showed how AI-generated anomaly detection results can be visualized in xyzt.ai. Instead of only receiving an alert, users can see the vessel movement, understand the surrounding context, and report on the detected behavior.
This makes AI outputs easier to interpret and easier to act on.
Making AIS data quality visible
Reliable maritime intelligence depends on reliable data.
AIS data can vary significantly by region, provider, sensor coverage, and message frequency. For data providers, integrators, and organizations that rely on AIS for decision-making, understanding data quality is essential.
During the webinar, we showed how xyzt.ai can be used to analyze AIS coverage and message gaps.
Users can inspect where data is available, where coverage is weaker, and how frequently vessels are reporting. This helps teams assess whether their data is fit for purpose and where additional sources may be needed.
Common questions include:
- Where do we have strong AIS coverage?
- Where are the gaps?
- Which regions need better data coverage?
- How often are vessels reporting?
- How does data quality differ between areas or providers?
By making data quality visible, teams can improve trust in their analytics, dashboards, alerts, and downstream products.
Detecting dark vessels by combining AIS and satellite data
AIS is a powerful data source, but it does not show everything.
Some vessels may switch off AIS, operate outside coverage, spoof signals, or appear in other sensor data without a corresponding AIS track. This is where multi-source maritime analytics becomes important.
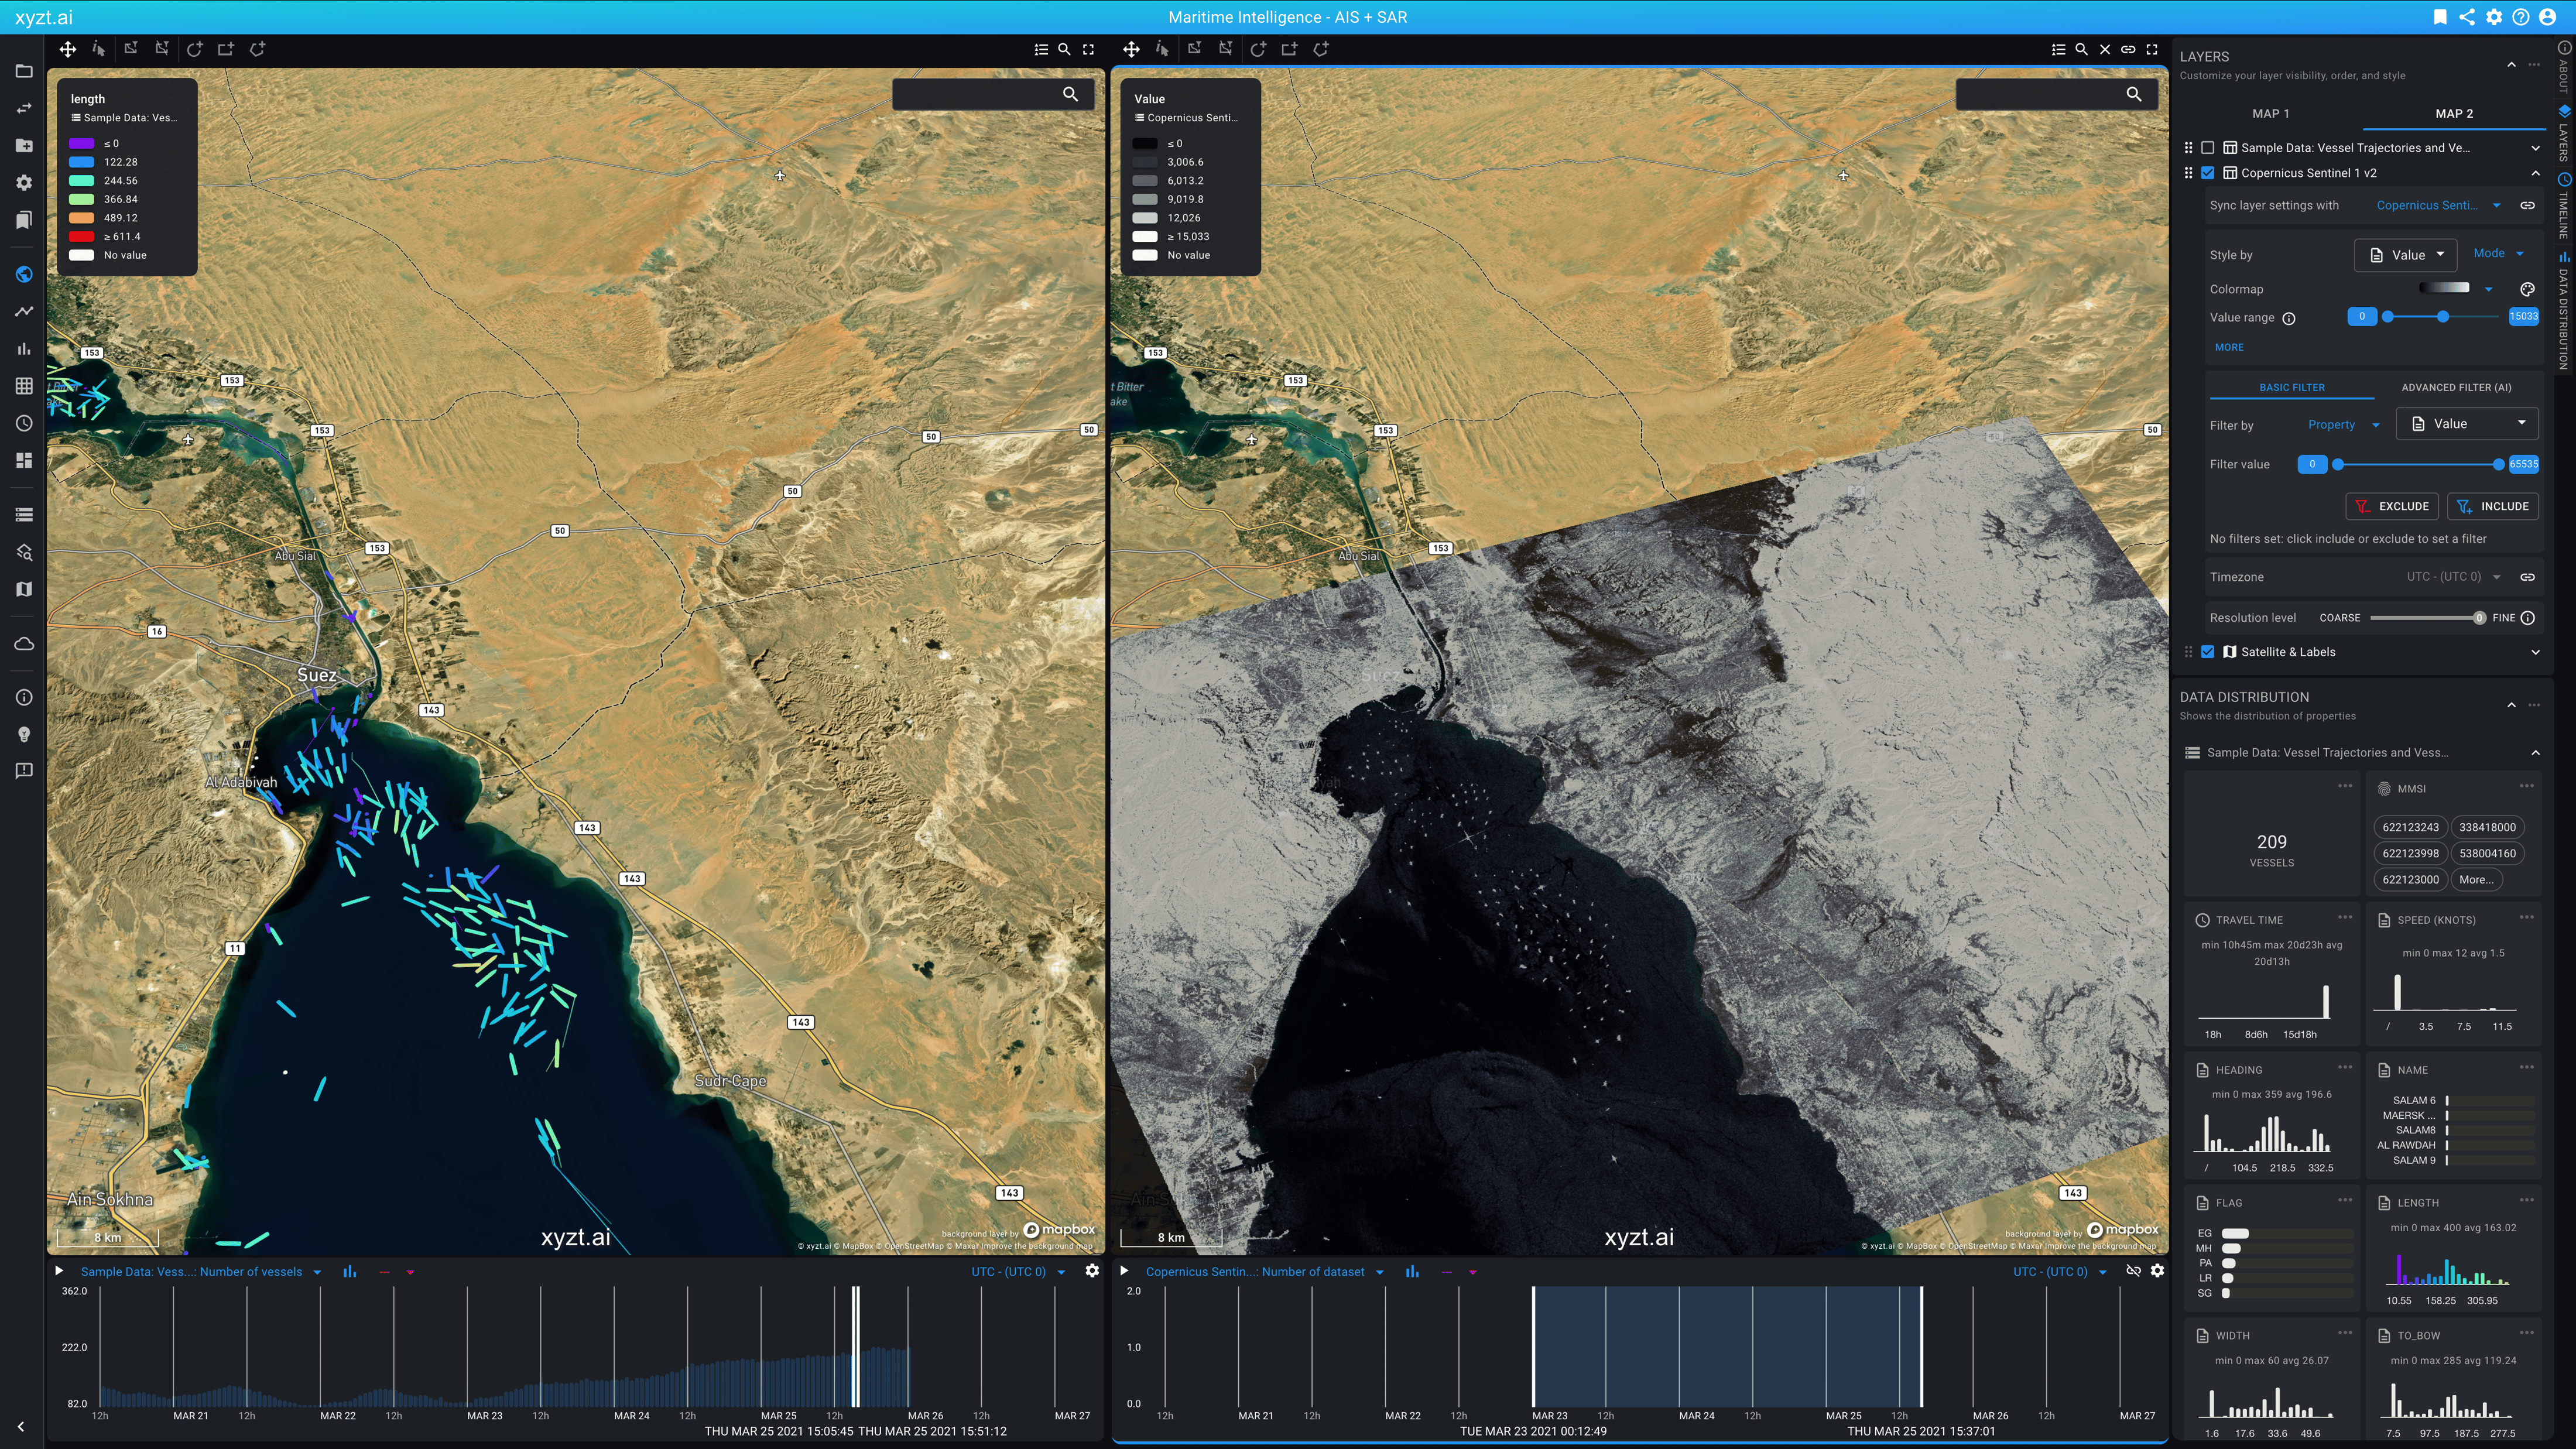
In the webinar, we demonstrated how AIS data can be compared with Sentinel SAR data from Copernicus. SAR, or synthetic aperture radar, can detect vessel-like objects from space using radar reflections.
By bringing AIS and SAR detections into the same analytics environment, users can compare what is being reported through AIS with what is physically detected by satellite.
When a vessel-like object appears in SAR data but has no matching AIS signal, it can be flagged for further investigation.
This approach supports dark vessel detection, maritime domain awareness, compliance monitoring, and security-focused analytics.
👉 Interesting in watching the full webinar? You can download it here.
Built for your data and your infrastructure
A key part of our approach is flexibility.
xyzt.ai is not limited to one predefined data source or one deployment model. Our platform is designed so organizations can work with their own maritime data, in the environment that fits their technical, operational, and security requirements.
We support two main deployment options.
xyzt.ai SaaS
Our managed SaaS environment is hosted and maintained by xyzt.ai. It is ideal for teams that want to get started quickly, without managing infrastructure themselves.
xyzt.ai on-premises
For organizations with stricter infrastructure or security requirements, xyzt.ai can also be deployed on-premises. This is especially relevant for defense, government, port, and critical infrastructure use cases.
The on-premises version can be deployed using Docker, Kubernetes, or customer-managed cloud infrastructure such as Azure or AWS.
This means maritime teams can use the same core analytics capabilities whether they operate in the cloud, on-premises, or in more controlled environments.
Scalable maritime analytics for large datasets
Maritime data grows quickly. AIS alone can generate billions of records, and many organizations need to analyze long historical periods across large geographic areas.
xyzt.ai is built to support this scale.
In our managed cloud environment, we typically support interactive datasets of around 1 billion records per dataset, with some customer use cases reaching approximately 1.5 billion records.
For even larger historical archives, our data store approach allows organizations to keep very large datasets indexed and ready for extraction. Users can then select a specific area, time period, vessel type, or other condition and create a focused dataset for interactive analysis.
This makes it possible to combine large-scale storage with fast, practical analytics.
Key takeaways from the webinar
The main message from the webinar was clear: vessel tracking is only one part of the maritime intelligence challenge.
To make better decisions, teams need to analyze vessel activity in context, combine multiple data sources, inspect data quality, detect anomalies, and share insights through dashboards and reports.
Here are the key takeaways:
- Maritime intelligence goes beyond vessel positions
It helps teams understand activity, risk, behavior, and change. - Real-time monitoring is stronger with historical context
Teams need to see what is happening now and understand how it developed. - Port intelligence can improve safety and operational awareness
Vessel behavior analytics can help ports detect abnormal movements and understand traffic patterns. - Data quality matters
AIS coverage gaps and message irregularities can affect analytics, alerts, and decision-making. - Dark vessel detection requires multiple data sources
Combining AIS with SAR, radar, or satellite detections provides a more complete maritime picture. - Infrastructure flexibility is essential
Maritime intelligence should run where organizations need it: SaaS, on-premises, cloud, or secure environments. - Scale should not limit insight
Teams should be able to work interactively with large maritime datasets, including billions of records.
FAQ
What is maritime intelligence?
Maritime intelligence is the process of turning vessel movement data and other maritime datasets into actionable insight. It helps teams understand vessel behavior, detect risks, monitor operations, assess data quality, and make better decisions.
How is maritime intelligence different from vessel tracking?
Vessel tracking shows where vessels are. Maritime intelligence explains what vessel activity means by adding analytics, historical context, alerts, dashboards, data quality checks, and multi-source analysis.
What data can xyzt.ai analyze?
xyzt.ai can analyze data with a location and timestamp, including AIS, radar, satellite detections, SAR data, gridded data, nautical layers, AI outputs, and operational datasets.
How can xyzt.ai support port intelligence?
xyzt.ai helps ports analyze vessel movements, traffic density, maneuvering patterns, abnormal behavior, and operational risks in and around port areas.
What is dark vessel detection?
Dark vessel detection identifies vessel activity that is not visible in AIS. By comparing AIS with sources such as SAR satellite data, analysts can detect vessel-like objects that may not be transmitting AIS.
Can xyzt.ai run on-premises?
Yes. xyzt.ai can run as a managed SaaS solution or as an on-premises deployment using Docker, Kubernetes, or customer-managed cloud infrastructure.
How much maritime data can xyzt.ai handle?
xyzt.ai is designed for large-scale space-time analytics. In our managed cloud environment, interactive datasets commonly reach around 1 billion records, with some customer use cases reaching approximately 1.5 billion records.
Ready to move beyond vessel tracking?
With xyzt.ai, maritime teams can turn AIS, radar, satellite, and operational data into scalable intelligence.
Whether you are monitoring live vessel activity, analyzing port operations, checking data quality, detecting dark vessels, or building maritime analytics products, xyzt.ai helps you work with your own data, on your own infrastructure, at the scale your use case requires.
Get in touch if you'd like to discuss your particular use case
👉 Interesting in watching the full webinar? You can download it here.
You might also like:
Working with AIS Data Is Such a Pain. Or Is It?
How to Obtain Business Intelligence with Data Analytics for Vessel Status Monitoring
Detecting Anomalous Vessel Movements with AI at Port of Antwerp