In this special webinar, Bart Adams, Founder and CTO at xyzt.ai, a big location data analytics platform, explains together with Pieter Van Bouwel, Lead Data Scientist at Port of Antwerp, the second biggest port in Europe, how artificial intelligence can be used to monitor port operations, improve port efficiency, and increase safety and security.
You will learn about:
- Different business cases for analyzing historic vessel movements in a maritime port.
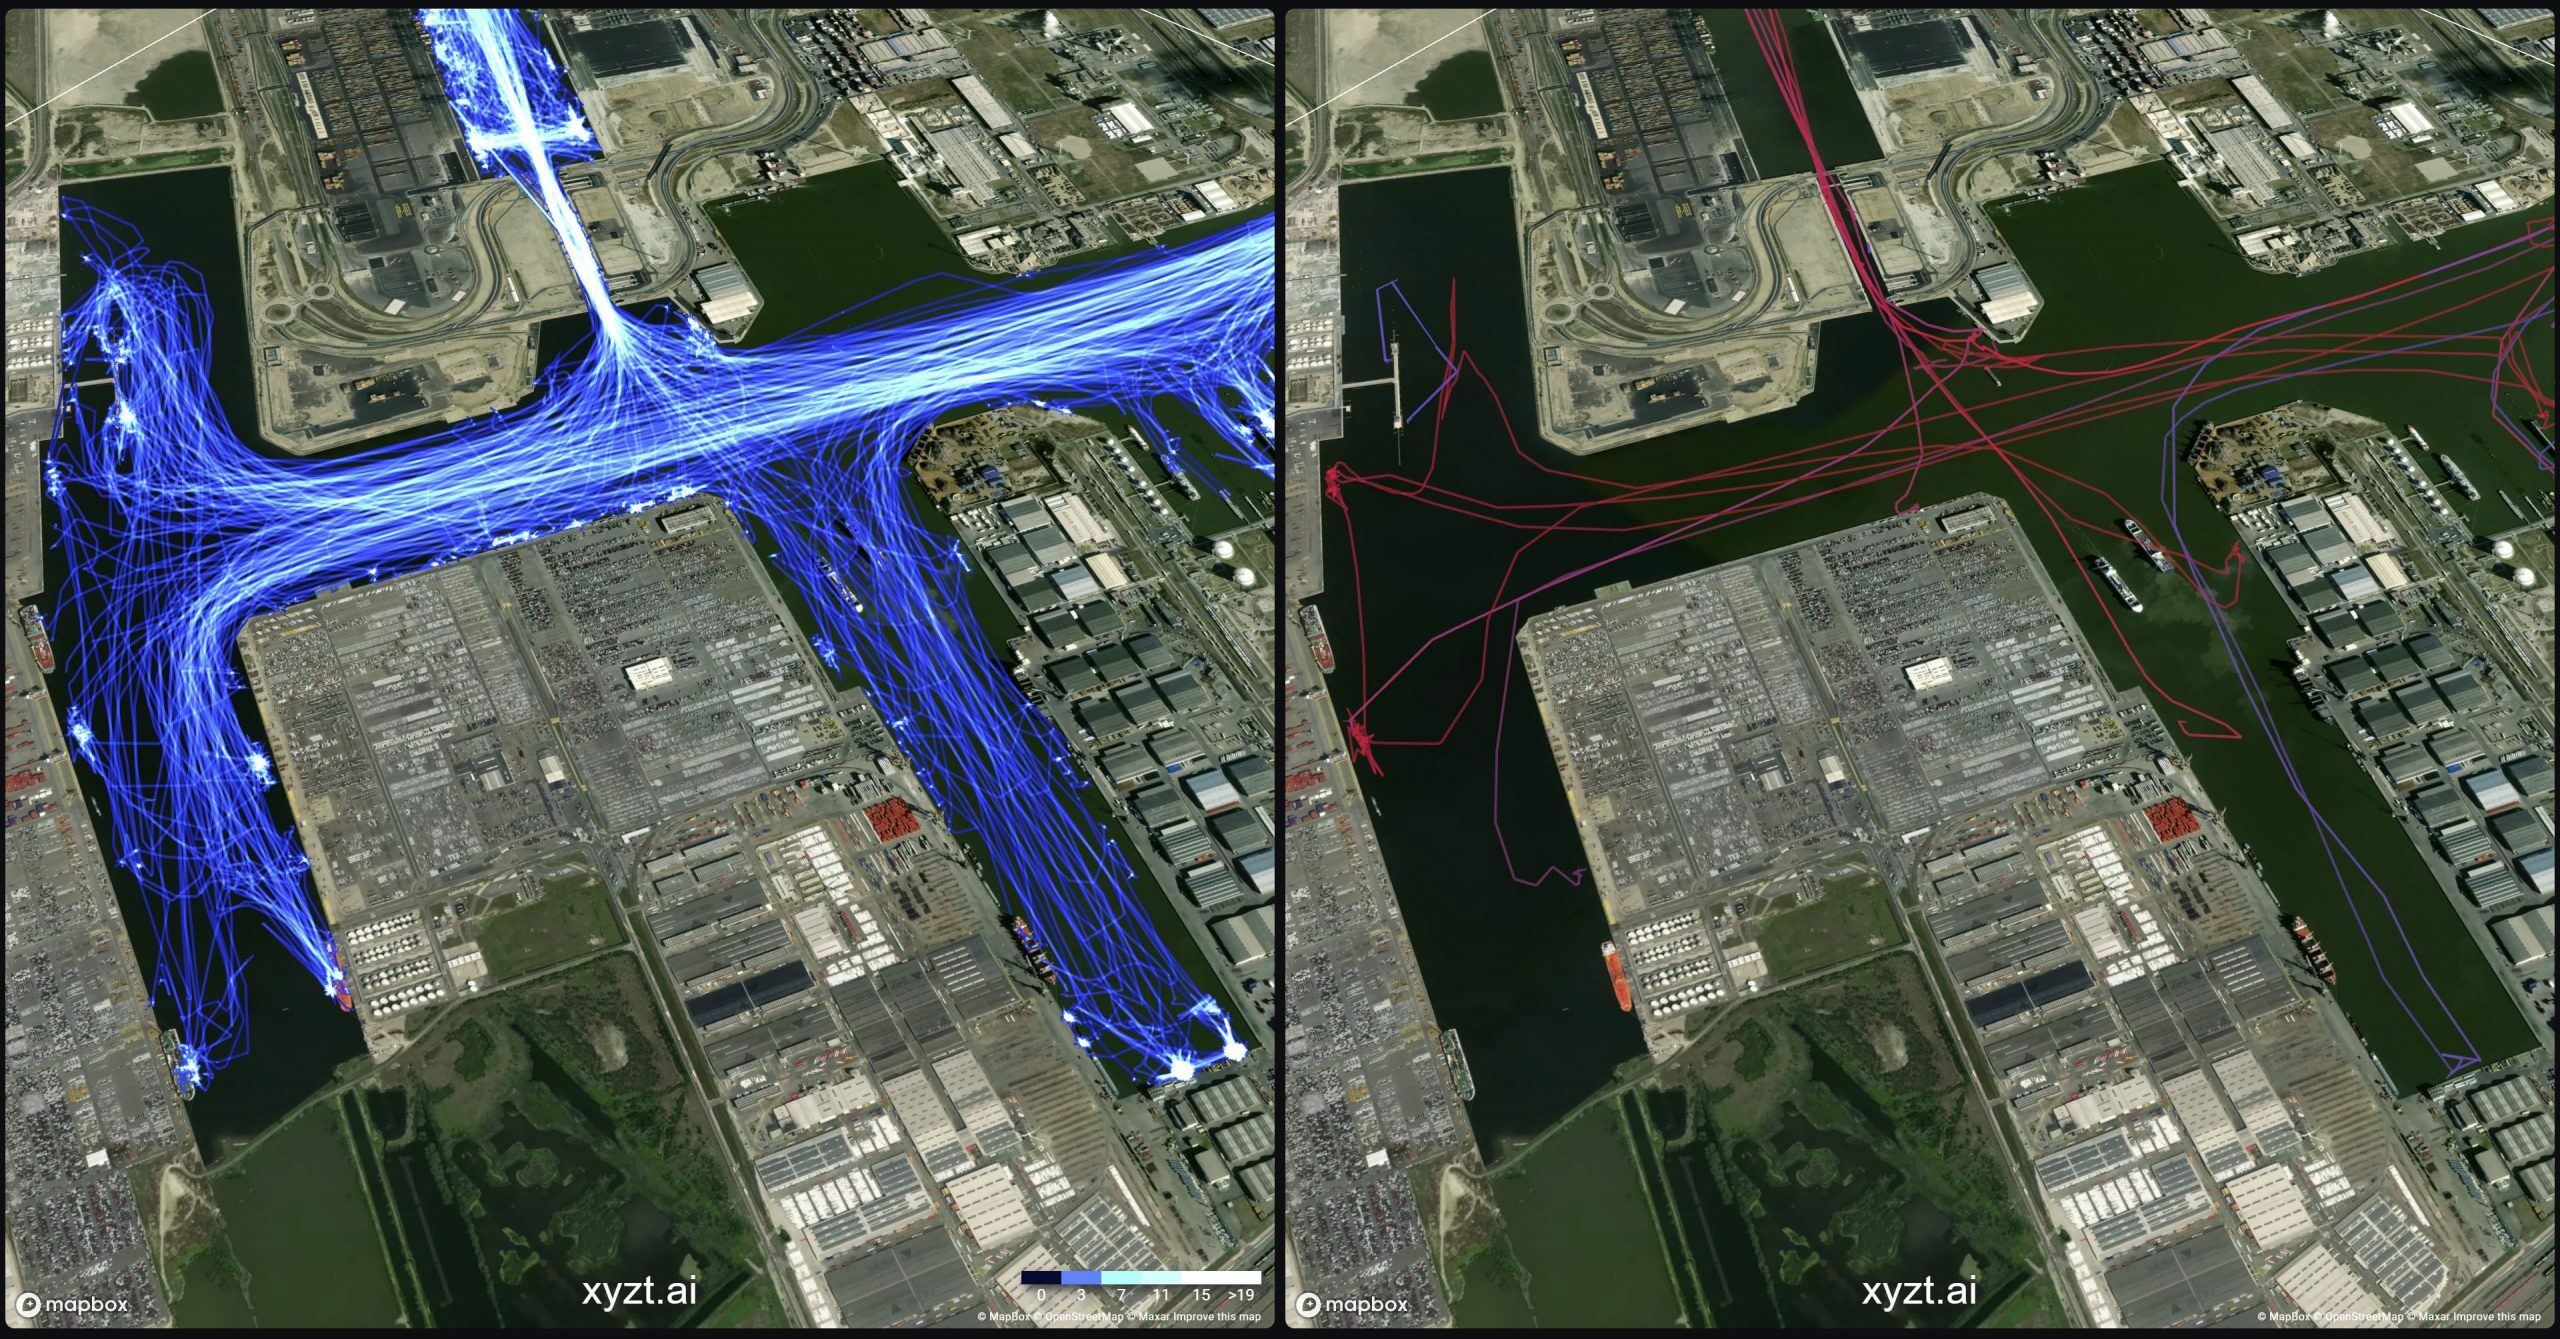
- How the artificial intelligence from the xyzt.ai platform spots anomalies.
- How Port of Antwerp is at the forefront of driving innovation and becoming a smart port.
If you would like to re-watch the webinar, you can sign up for a copy or scroll down to catch up on the highlights discussed during the xyzt.ai and Port of Antwerp webinar.
Why track vessel movements in a maritime port?
For the past two decades, Port of Antwerp has been seeing a continuous yearly increase in traffic. Growth is, obviously, not the issue, but the limitation of geographical space can become a problem for a maritime port. Consequently, to support and stimulate the growth of Port of Antwerp, the company needs to handle its port operations in an efficient and smart way. Therefore, Port of Antwerp adopts a strong digital strategy to keep driving innovation and digitalization to become a smart, safe, and efficient global port.
“From the first meeting with xyzt.ai, we were very impressed with their visual analytics platform. It’s a fantastic toolbox that generates insights from large volumes of location data with incredible speed and efficiency. Also, they have a great team of experts with the right mindset and work ethic. Working with xyzt.ai helped Port of Antwerp accelerate the transition towards a smart and safe port.”
Pieter Van Bouwel, Lead Data Scientist at Port of Antwerp.
Use cases for tracking vessel movements
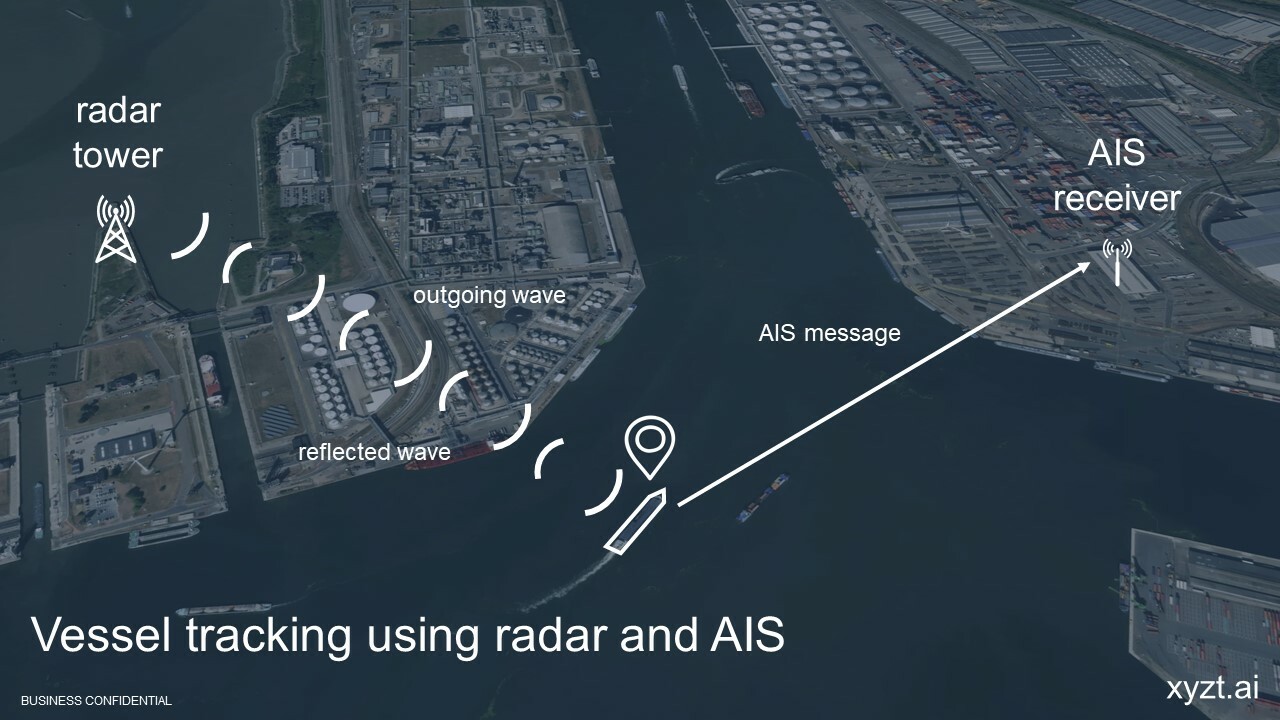
Port of Antwerp tracks vessel movements using a combination of radar and AIS data as a single source of truth for the following reasons:
- Vessel traffic control: A port needs real-time situational awareness to plan and control the activity in the port.
- Insight generation from historic vessel data: Collecting AIS and radar data means you build up a big database over time. Using the xyzt.ai platform, you can review huge volumes of data in one setting and learn from the vessel movements and patterns for more efficient future operations.
- Smart port initiative: Port of Antwerp is building a digital twin to optimize its operations. This digital twin is supported by a digital brain, called Antwerp Port Information & Control Assistant (APICA), that needs real-time and/ or historic vessel movements data to operate on.
- Business cases: Tracking and monitoring vessel movements is necessary for various business cases, such as compliance and performance. Read more about this in the next section.
What are the business cases for historic vessel movement data?
Of course, it depends on what you are looking for and what you wish to accomplish when analyzing AIS data or any other vessel tracking data. To illustrate, here are four main business use cases when analyzing historic vessel movements in a maritime port:
- Compliance: There is a lot of daily activity in a port and regulations need to be followed. Monitoring and analyzing vessel data can indicate anomalous vessel movements, such as inefficiencies, illegal activity, or safety-related issues.
- Safety: Analysis of a collision or near-collision can reveal opportunities for increasing safety in port fairways and terminals.
- Port performance: Analyze the operational efficiency of your port and the neighboring and competing ports to learn how you can improve your performance.
- Environmental: Driven by the objectives of sustainable development and international regulations, the maritime industry has embarked upon the energy transition. Ports can analyze historic vessel movement data to learn if their infrastructure is ready for this energy transition. The data can also be used to learn if there are environmentally-harmful activities taking place, such as the degassing of tankers.
How do you analyze vessel movement data?
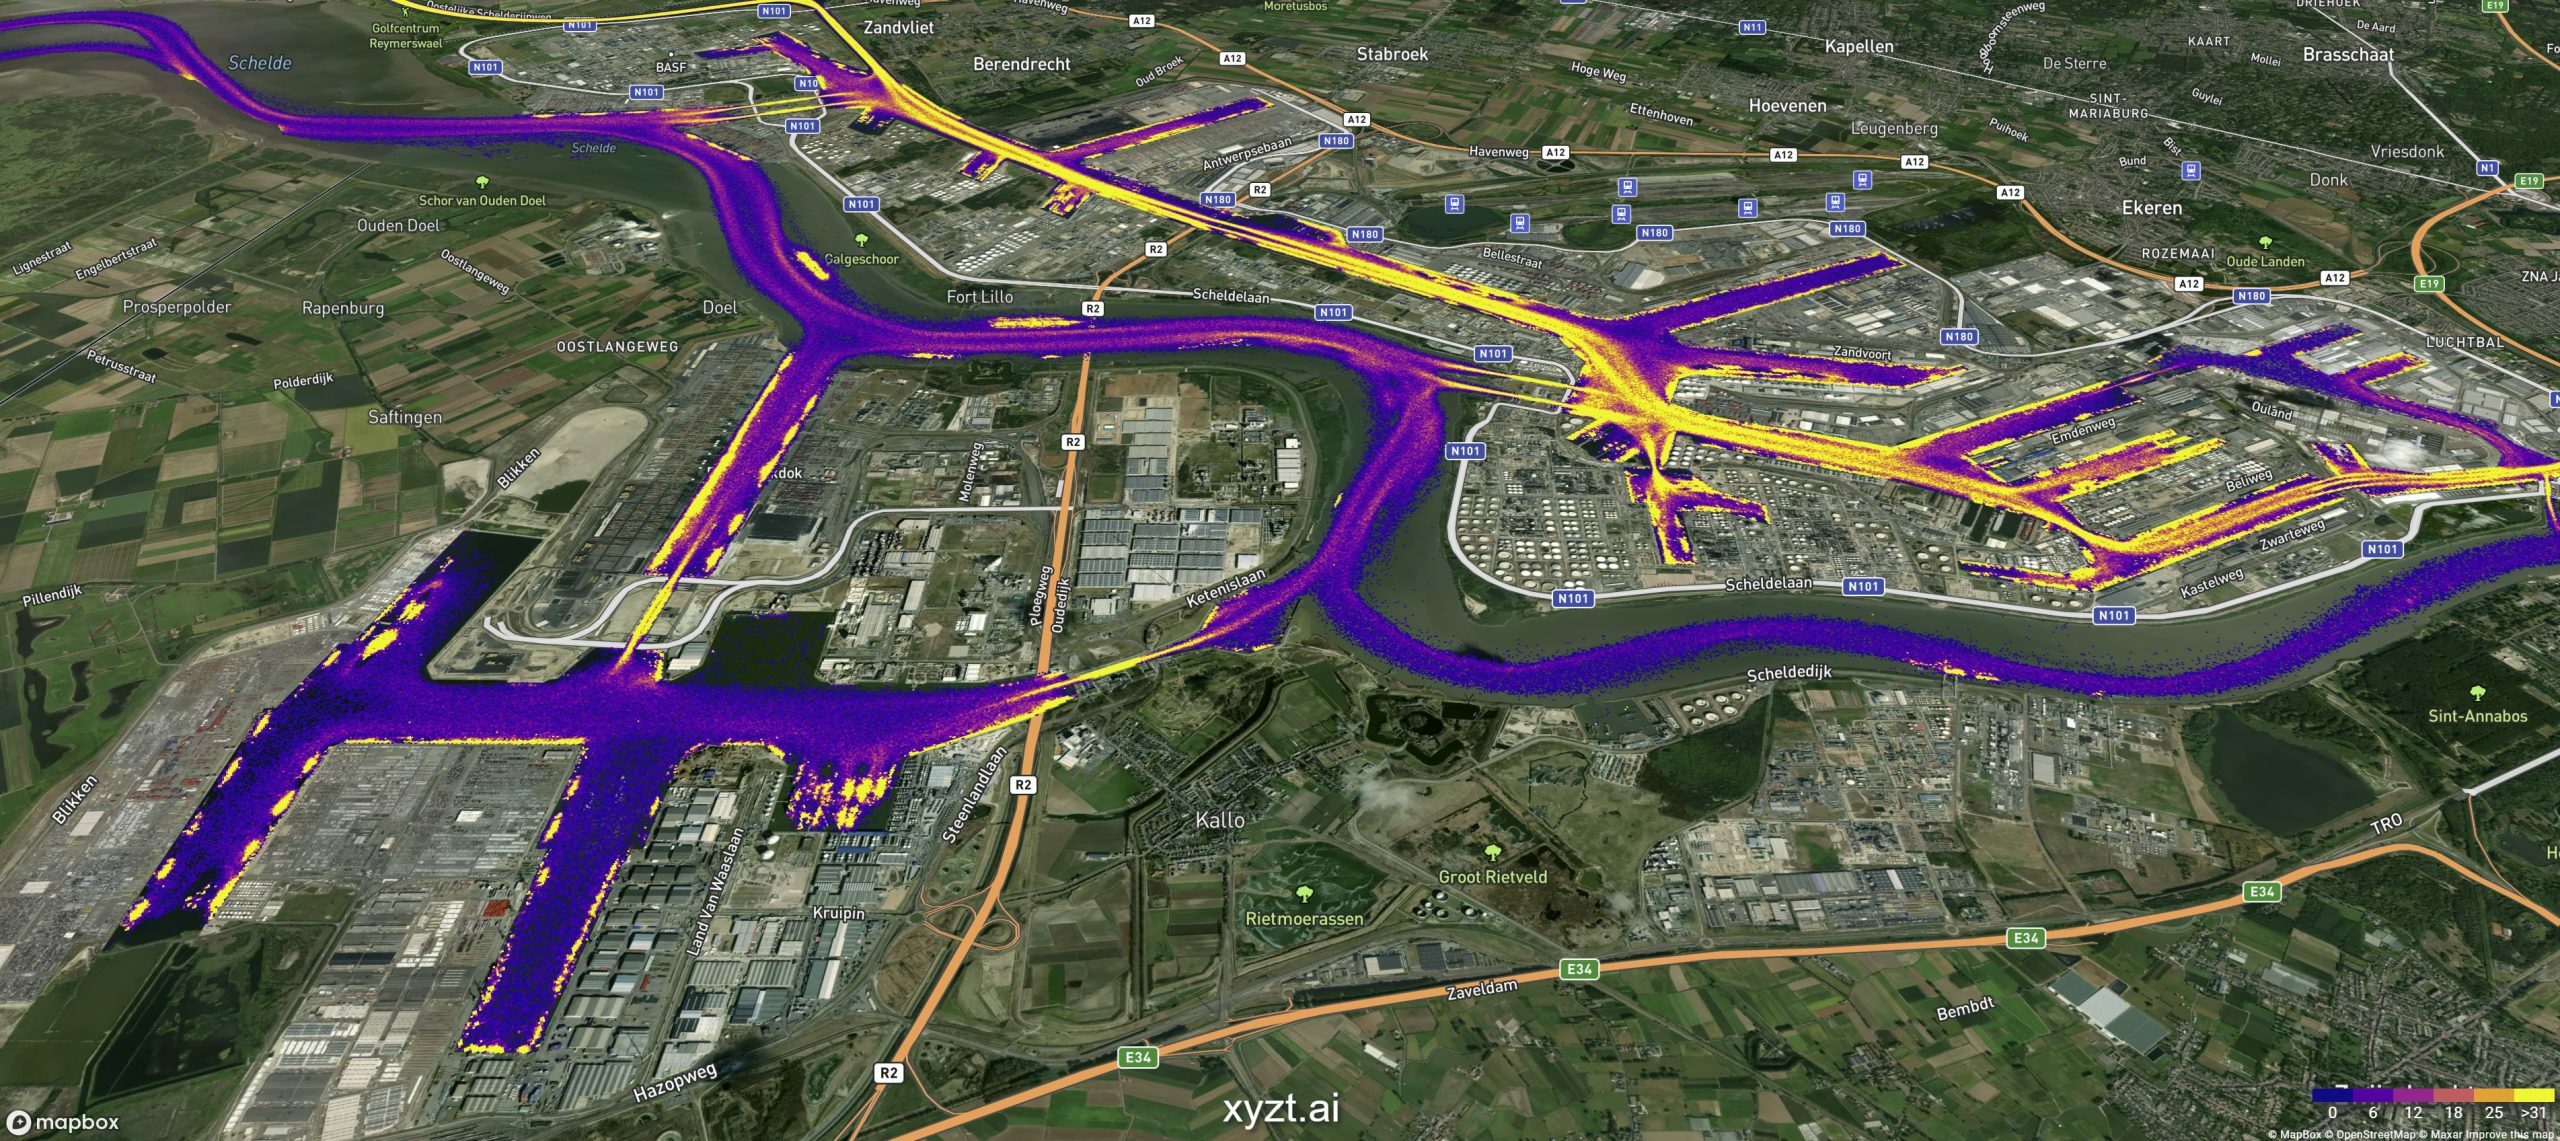
Firstly, you will need to possess AIS, radar, or any other ship tracking data. If you’re unsure how to obtain such data, you can have a look here. Secondly, you will need an efficient and powerful tool to visualize and analyze the data in order to extract valuable insights. Data without the right exploration tool is mostly just noise.
Unlock the potential in your big location data
xyzt.ai is an interactive big location data analytics platform that provides its users instant and easy usability. We recently upgraded the platform with new functionalities, you can read more about that here.
- Why big data? The xyzt.ai platform scales to over 1 billion location records while maintaining interactivity and a fast update rate. Important to remember: xyzt.ai platform only supports and visualizes location data.
- Why interactive? It is one thing to visualize data, but navigating through and interrogating the data to discover valuable insights is something else. xyzt.ai continually strives to optimize this process by providing efficient ways and adding new perspectives to analyze location data.
Bart Adams, CTO of xyzt.ai, demonstrates some of the features, such as split-view analysis, data-driven styling, trend analysis, origin destination, and distribution analysis during the xyzt.ai webinar with Port of Antwerp. If interested, you can sign up to rewatch the webinar here. - Why easy and instant usability? xyzt.ai is designed to be a true self-service analytics platform for everyone. You don’t need to be a data scientist or apply any custom development to get started. If you have your data set ready, you can start exploring from day one.
How does xyzt.ai detect anomalous vessel movements?
Before we briefly explain how xyzt.ai’s artificial intelligence operates, we would like to point out three objectives that were important when the algorithm was designed. xyzt.ai identified three goals that should be met to make sure the artificial intelligence is effective and reliable.
- Data-driven: There should be as little to no human intervention when looking at the data and identifying possible suspicious movements.
- Automatic: The artificial intelligence not only learns what is and what is not anomalous in an automated manner, but also automatically assists the analyst in finding “the needle in the haystack” by providing a ‘degree-of-interest’ ranking.
- Explainable: The last goal is the most difficult one. Detecting anomalies is not enough. The artificial intelligence must also be able to provide information on why a vessel movement is ranked as anomalous.
How can artificial intelligence be used to exploit historic vessel movement data to separate the normal trajectories from the abnormal?
A ranking algorithm following two approaches to identify anomalies from trajectory data
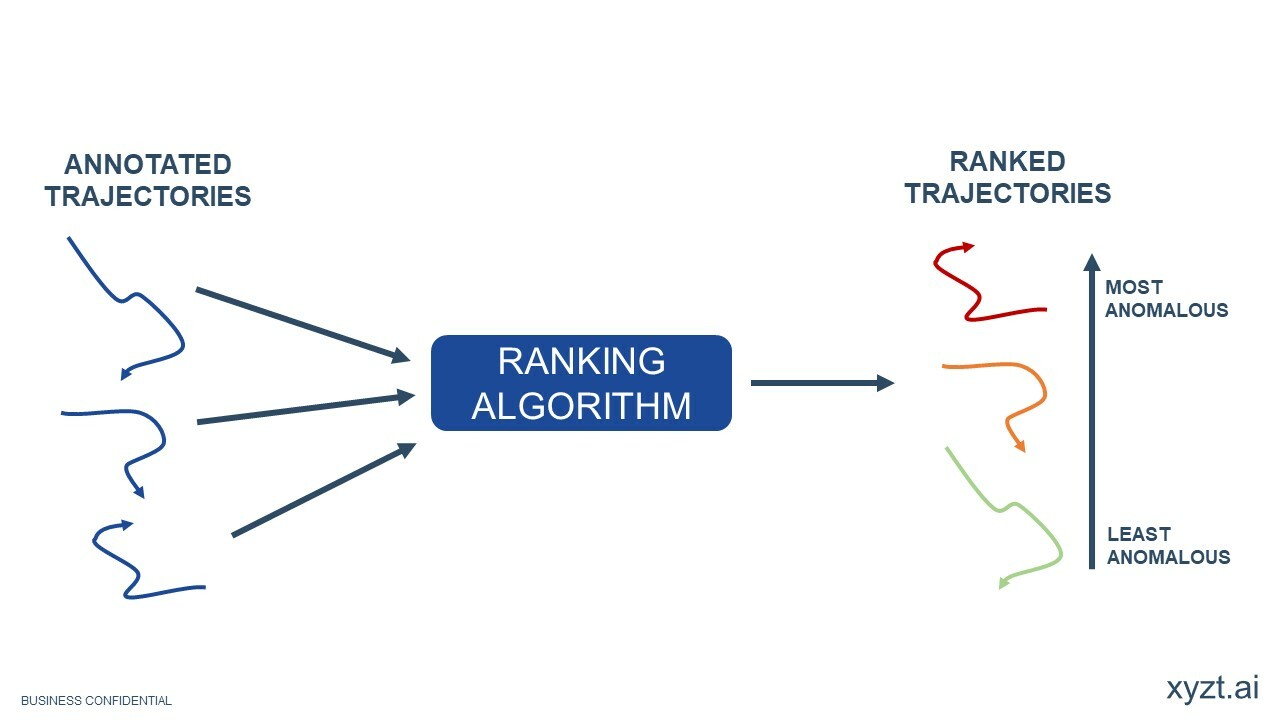
Various data sources, such as radar, AIS data, and GIS locations (locks, terminals, etc.) are fused together and used to determine annotated trajectories. In other words, the various journeys the many ships have made during a certain timeframe are composed by combining various data sources. These journeys are called annotated trajectories and are used as input for the ranking algorithm.
Ranking algorithm: the artificial intelligence processes all of the annotated trajectories and determines which ones are moving in a different or anomalous way. In addition, the algorithm selects and ranks the anomalous movements from most to least anomalous following two approaches.
First approach: Auto-encoders
- Using auto-encoders, the artificial intelligence is able to learn what the normal movements are. Afterwards, it is able to compare all of the trajectories and measure which ones are different from the original.
| PROS | CONS |
| – Easy to implement. | – Training is computationally expensive. |
| – Once trained, fast to evaluate. | – Difficult to tweak. |
| – Avoid implementing 1-1 copy. | |
| – No explanation is given as to why it is an anomaly. |
Second approach: K-nearest neighbors
- K-nearest neighbors: An old machine learning approach that requires a lot input data. In this case, the algorithm tries to detect anomalies by selecting a trajectory and by comparing it with a certain number (k) of the nearest other trajectories (neighbors). Afterwards, the average weighted distance between the selected journey and the nearest journeys is measured for oddness. In other words, to determine if it can be classified as an anomaly.
| PROS | CONS |
| – Nearest neighbors explain why it is an anomaly | – More expensive to evaluate. |
| – Easy to tweak importance of features | – How to define distance between trajectories? |
5 lessons xyzt.ai has learned from detecting anomalous vessel movements with AI at Port of Antwerp
xyzt.ai has learned a lot from working together with Port of Antwerp on this exciting project. Listed below are 5 important lessons we wish to share with you:
- Invest in automation from the start. This applies to the training of the algorithm, as well as the validation of suspicious trajectories. When working on a big project with a huge data size, you must automate as much as you can to avoid wasting time on repetitive actions.
- Context is extremely important. Detecting an anomaly solely based on its geographical movement is very difficult. Therefore, the algorithm holds various factors, such as location of a stop or time of the day, into account to build up context so it can provide an efficient and accurate analysis.
- Involve operational stakeholders early on to get better insights and feedback on your results. Their industry expertise will start discussions, instill ideas, and provide direction.
- An anomaly can be a new observation. A vessel following a different route does not imply suspicious or anomalous movement. It could be a new movement happening for a good reason that has not been previously recorded.
- Use continuous ranking (most to least anomalous) instead of binary (yes or no) ranking for anomaly detection.
Key takeaways
To conclude, we would like to provide you with three key takeaways from the webinar.
- Vessel tracking has business cases beyond real-time situational awareness.
- Technologies exist to visualize historic location data at scale.
- Your competitor is implementing their digitalization strategy. Don’t get left behind!
Did you miss the webinar? If so, don’t worry, request access to watch it.
Get Started Today!
Contact us to see how we can help you with your visualization and analysis needs.
