The maritime industry is undergoing a digitalization revolution. Port authorities, shipping companies, and maritime agencies have adopted automation more slowly than comparable sectors. However, change is coming, and the pace is now starting to accelerate. Many companies in the maritime industry lack good quality, maritime location data, or scalable tools to extract and disseminate business insights from the data, and this is where xyzt.ai and Spire can help.
If you would like to re-watch the webinar, you can sign up for a copy here or scroll down to catch up on the highlights discussed during the xyzt.ai and Spire Maritime webinar.
WHAT IS MARITIME DATA & WHY IS IT USEFUL?

Maritime data, also known as Automatic Identification System (AIS) data, was originally used for maritime collision avoidance. Through AIS, vessels communicate their location and receive the position of the surrounding vessels. Maritime data is Big Data. The information contained within AIS is not limited to longitude and latitude. You can find a lot more within the data: a timestamp, ID, status, activity, and draught to name a few.
AIS data easily piles up in the millions upon millions of rows as the data accumulates quickly when logging multiple hours and days of vessel traffic. It gets really interesting once you start thinking about all the potential use cases and once you consider data provider companies, such as Spire, collect this information globally. It no longer is a system solely used for collision avoidance.
How Can I Use Maritime Data (AIS)?
There are countless possibilities of how one can use AIS data for analysis and unique business insights. Here are a few examples:
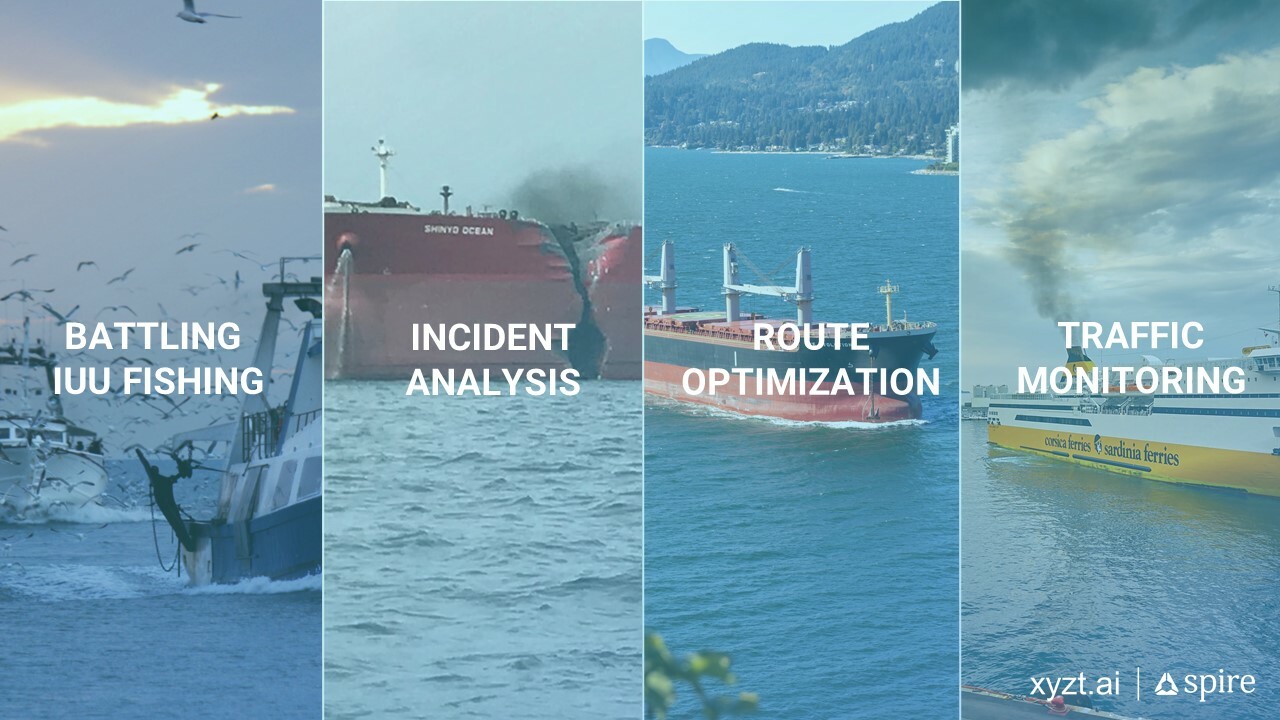
- IUU (Illegal Unreported Unregulated) Fishing: Companies, like Global Fishing Watch, are using AIS data to gain insight to battle these illegal practices.
- Incident Analysis: Thanks to the AIS data you basically have a recording of what happened at sea. Therefore, you are able to review how the incident occurred. For example, this could be valuable for insurance companies or port authorities.
- Route Optimization: With the help of AIS data, operators are able to take advantage of cost-efficient routes and other cost reducing possibilities.
- Traffic Monitoring: This one is especially useful for port authorities. For example, how ports can minimize pollution and offer a smoother traffic flow.
Again, these are just a few concrete examples to help paint a picture. The many possibilities to extract value from maritime data are out there. If you are unfamiliar with how to obtain AIS data, read our blog post about the subject.
TAKING A DEEP DIVE INTO MARITIME DATA
To further illustrate the value and use cases for maritime data, Adams explains in detail how you can use the xyzt.ai platform by giving three demos. In this section, you will learn how to efficiently analyze the information and how to apply and use the different tools available to your advantage.
First Demo: Visual Analytics
After logging in to the platform, Adams starts with a brief explanation of how to navigate the first page, also known as the ‘Admin Console’. There you are able to define projects, connect datasets, create a dashboard, and more.
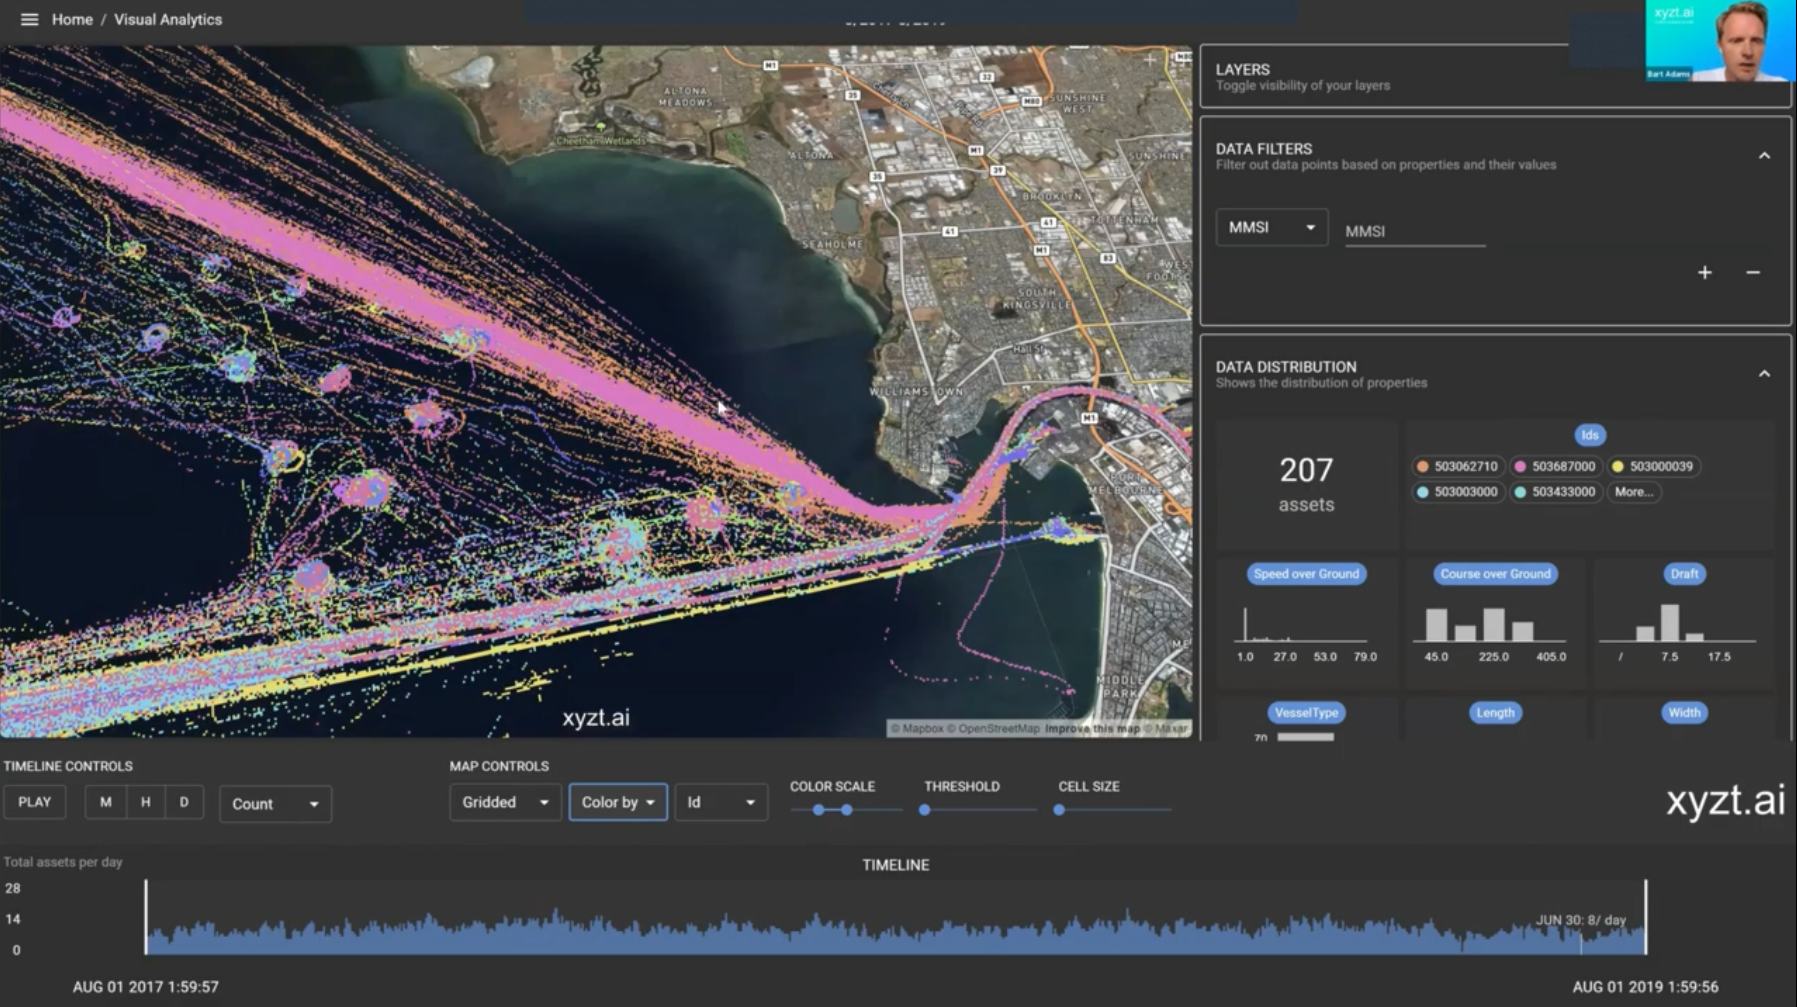
Adams is using a couple of different maritime datasets he obtained from Spire. The first one covers two years’ of AIS data and contains more than 1.4 billion location-related messages. Once you have uploaded your dataset and made the necessary configurations, you are ready to proceed to the ‘Visual Analytics‘ page.
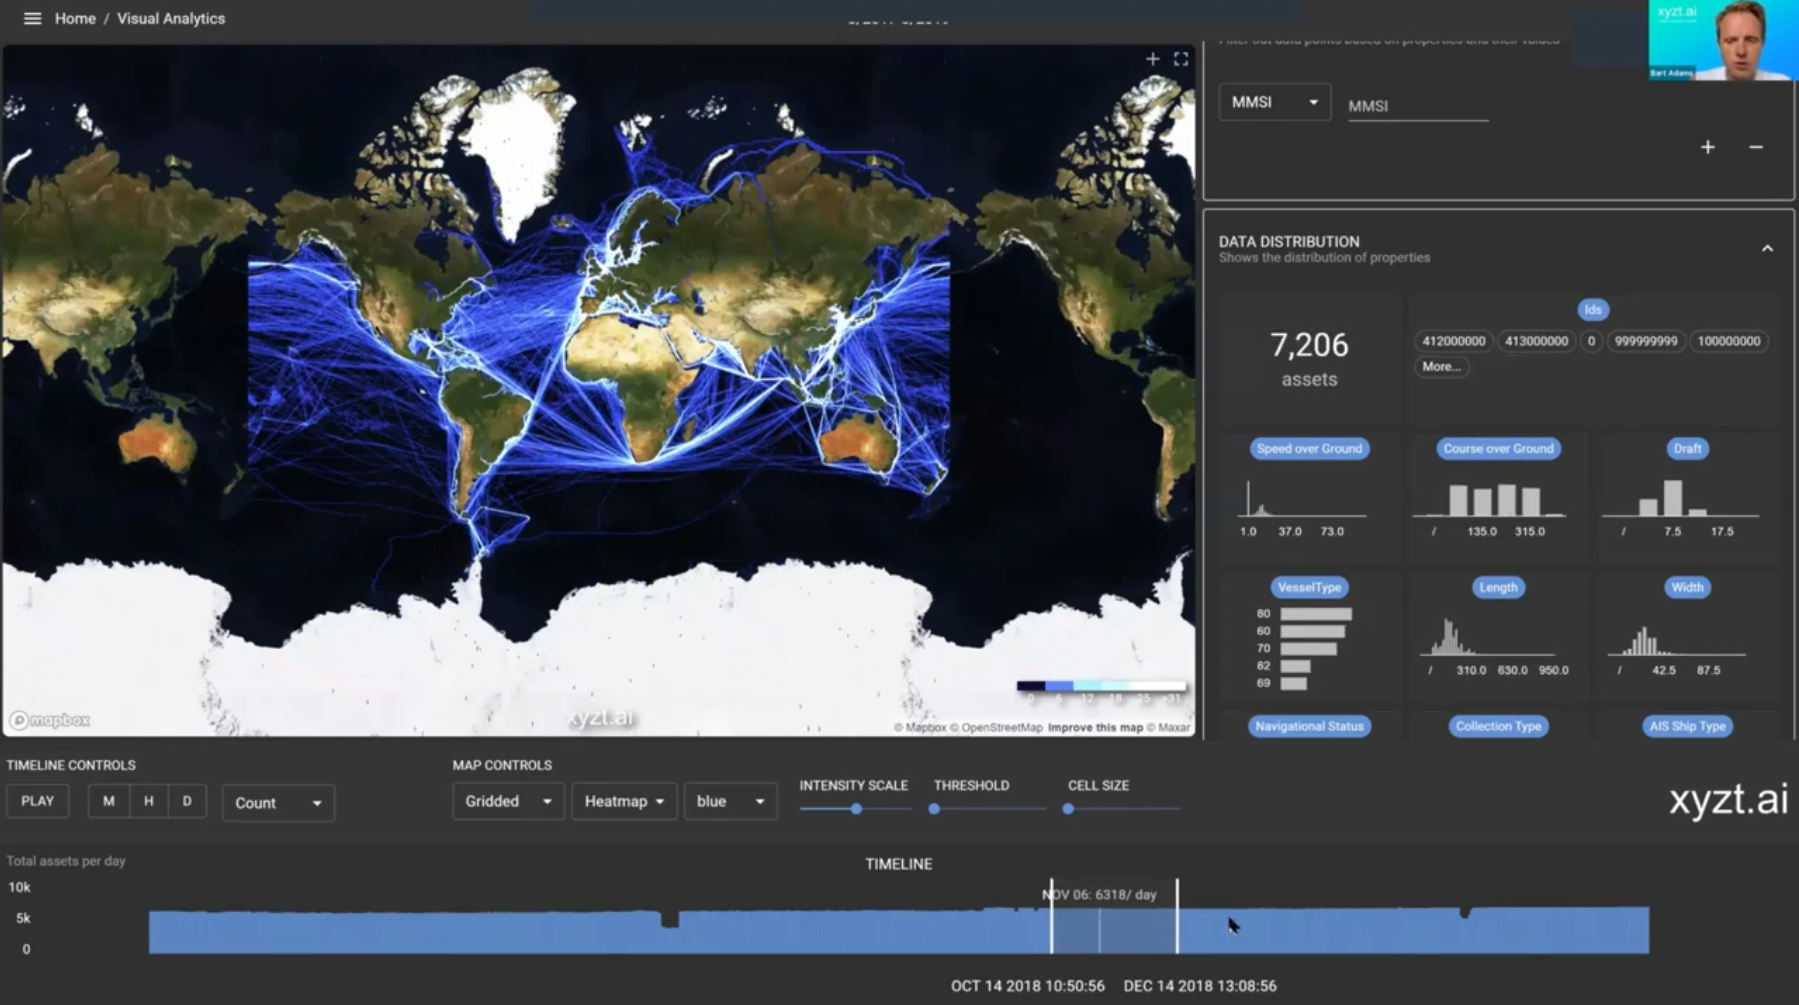
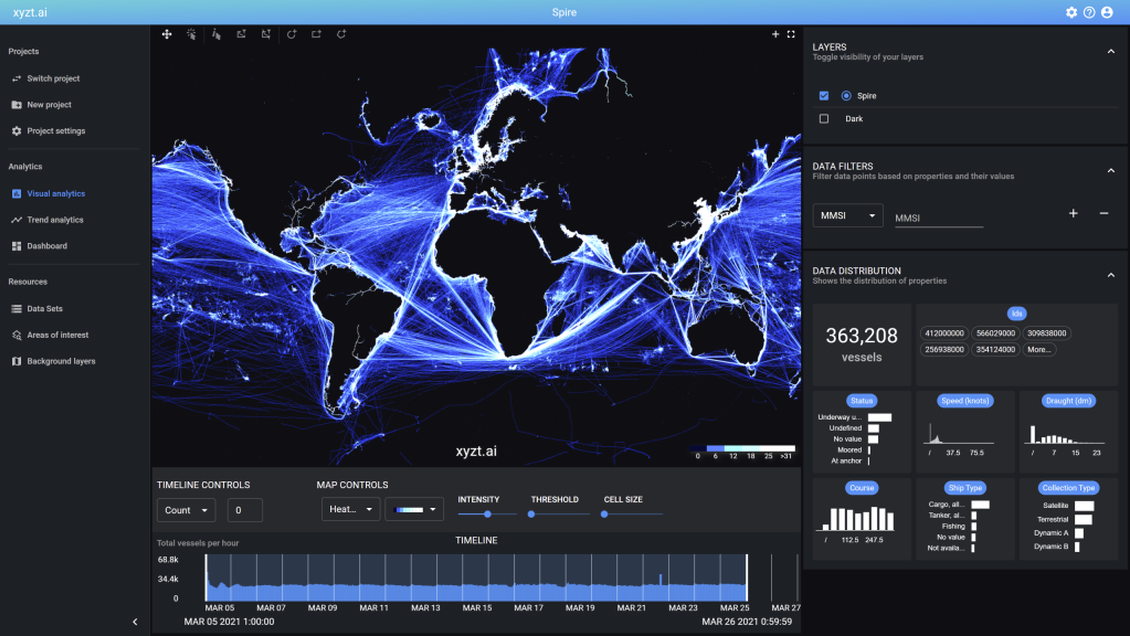
The Visual Analytics page provides three different ways to view the data in an easy, clear, and interactive way:
- Heatmap: This screen visualizes worldwide coverage of the data. It is able to process billions of records with a sub-second update rate all the while maintaining a high-level of interactivty. For example, by zooming in and out of a specific region.
- Timeline: Using this view, found at the bottom of the screen, you are able to see the number of different vessels counted on a particular day. You can also select a specific time range and analyze within this period of time.
- Attributes: This view shows the distribution of different properties found in the dataset. As mentioned previously, AIS data contains more than just location records. Here you can further interrogate your data, for example, differentiating between the different vessel types active in a certain region.
Three Interactive Views For Your Maritime Data
The three views provide information on the same data, but from a different perspective. This allows you to dig in and analyze the data to its full capacity. Adams points out that one of the unique capabilities the xyzt.ai platform provides, is that besides being able to process billions of location records, it also is capable of presenting the data interactively. As you zoom in or out and navigate through the map, you will notice that all the views (heatmap, timeline, attributes) are being updated simultaneously so you can accurately analyze the chosen frame.
Besides the tools mentioned above, there are other options to further specify your analysis and to help you discern signals from noise. Basically, you can apply any filter to specify your search. For example, you can investigate the data by changing styling. This means that you can change the color on the heatmap by certain attributes. In this case, Adams is coloring by ID, which means that every vessel type on the map is painted in a different color. This allows you to analyze the movement pattern of certain vessels in a certain area.
Second Demo: Split Screen
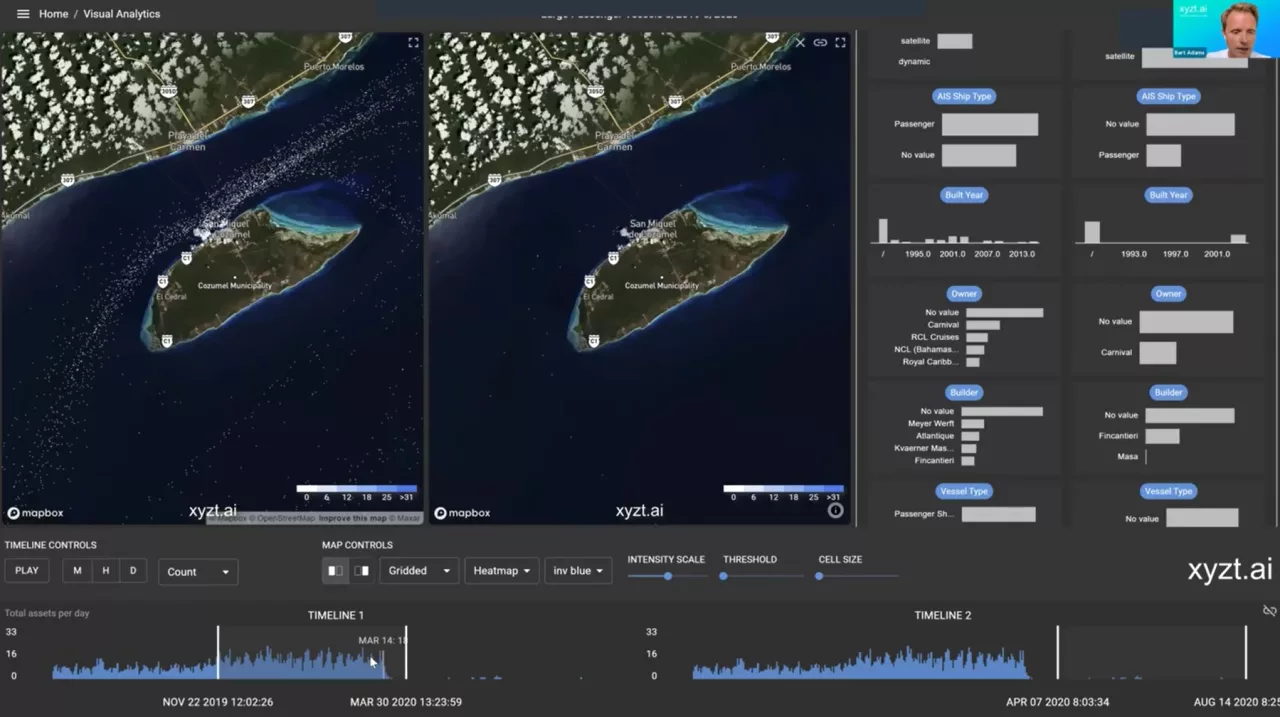
In the second demo, Adams uses a different and more specified dataset to analyze the global and local effect of Covid-19 on large passenger traffic. For this analysis, he applies the split-screen function so he can compare passenger travel in the same region, but at a different time: before and after Covid-19. The split-screen option doubles all views. This means that you have two heatmaps, two timelines, and two analyses, which allows you to compare the data instantly.
Third Demo: Trend Analytics
During the third demo, Adams expands on another use case: monitoring tanker and terminal activity. In this case, he adds an additional dataset on top of the base dataset to visualize more specific information about vessels and their activity on the sea. In this example, he uses metadata obtained from the ‘Enhanced Vessel Database’ from Spire. This creates a broader and more rich analytical profile with a lot more attributes available on the Visual Analytics page.
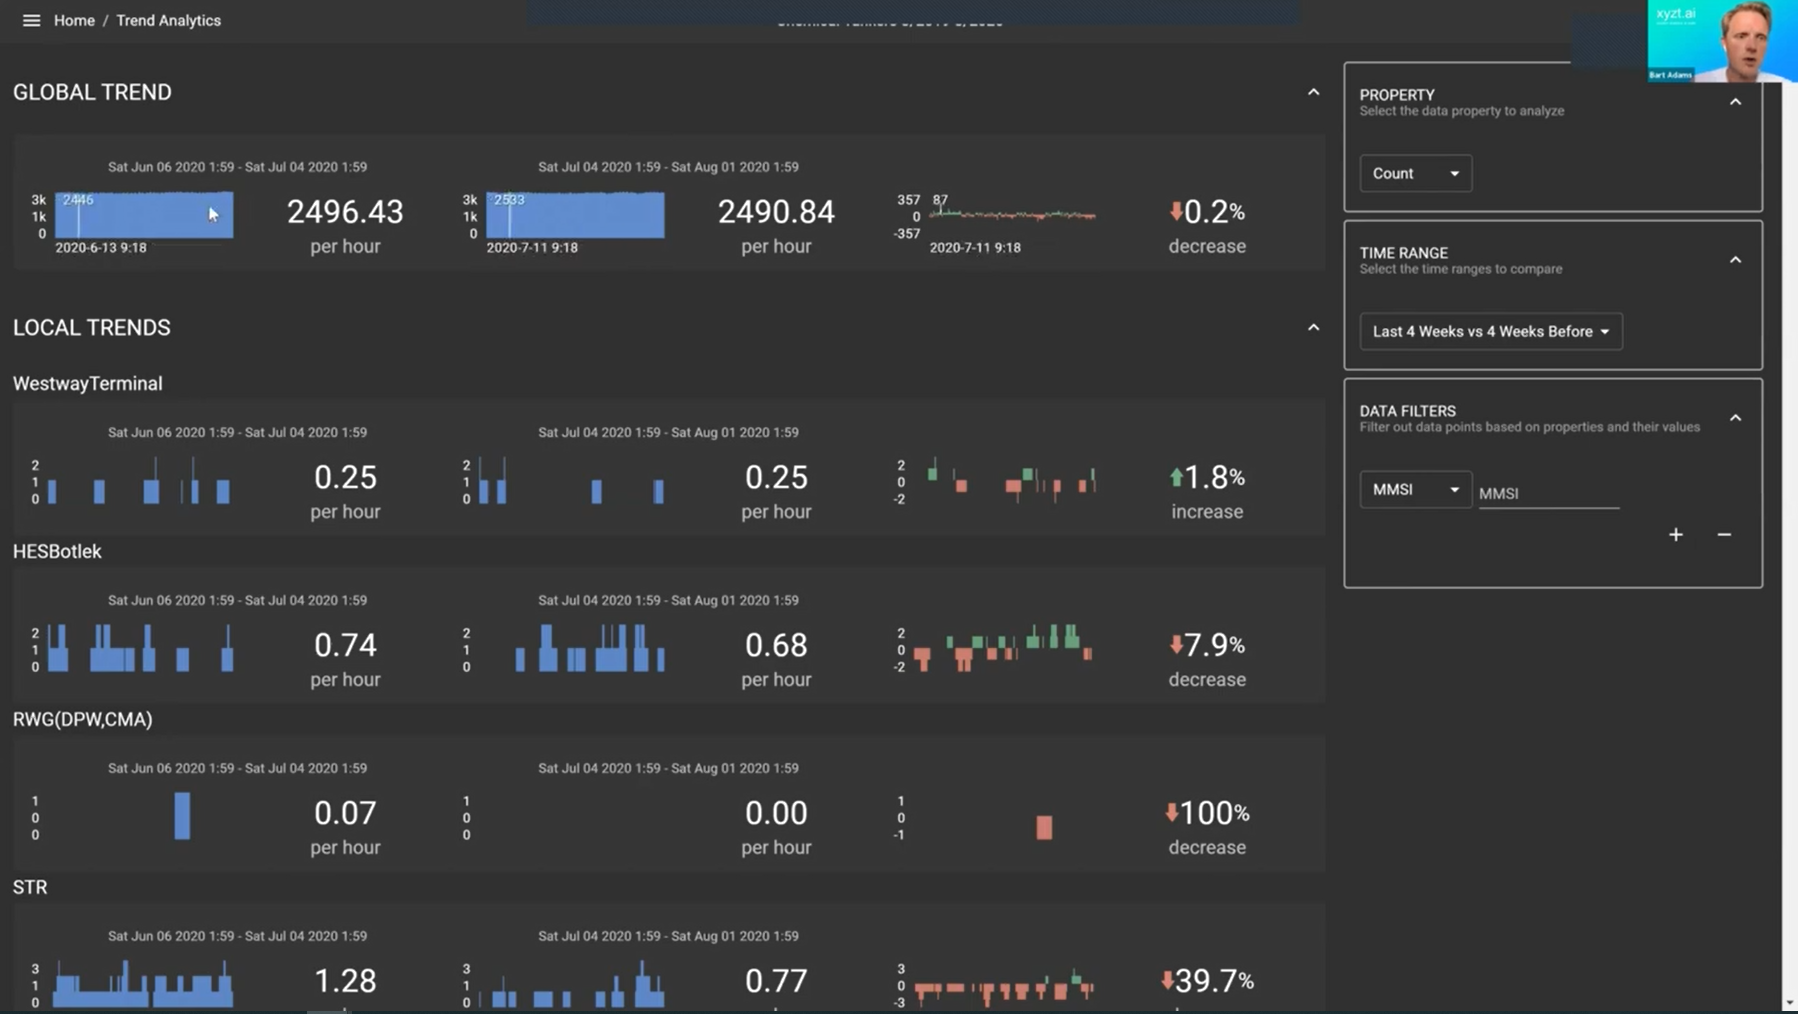
In conclusion, Adams explains another major feature on the xyzt.ai platform: ‘Trend Analytics’. By uploading a GeoJSON file, which are polygon files, you give instruction to the system to analyze activity in well-defined places, the so-called ‘Areas of Interest’. These areas offer a lot of new possibilities to analyze the data visually, but also through the Trend Analytics page. This page is accessible through the Admin Console and offers the possibility to create dashboards and to compare global and local trends by selecting different properties of the data and by comparing them over time. This provides you with a clean and fast overview of how the selected properties have changed within the selected time range.
5 STEPS TO UNCOVER THE HIDDEN TREASURE IN YOUR MARITIME DATA
Smart analysts need great tools and accurate data. Read on to learn how to put the two together to make better strategic business decisions.
| Tip | Your Impact |
|---|---|
|
1. Start using maritime data |
• High-quality data from Spire is available now • You don’t need specialist knowledge to extract the insights you need any more |
| 2. Use an interactive tool |
• Easy to upload data • Interactive feedback when applying filters • Sub-second response times • Beautiful and informative visualizations |
| 3. Start exploring the data visually |
• Easily digest big data • Analyze spatial-temporal data • Filter multiple attributes • Identify patterns and areas of interest |
| 4. Extract more and smarter insights from maritime data analysis |
• See the larger context to identify patterns quickly • Zoom in on areas of interest • Compare data between attributes in the same area • Compare data in different areas • Use multiple attributes for rich insights |
| 5. Share and collaborate |
• Share with managers, peers, stakeholders • Welcome feedback and further analysis • Choose a visualization tool that enables easy sharing |
HOW CAN XYZT.AI AND SPIRE HELP YOU
“A picture tells more than a thousand terabyte’s on your disk”
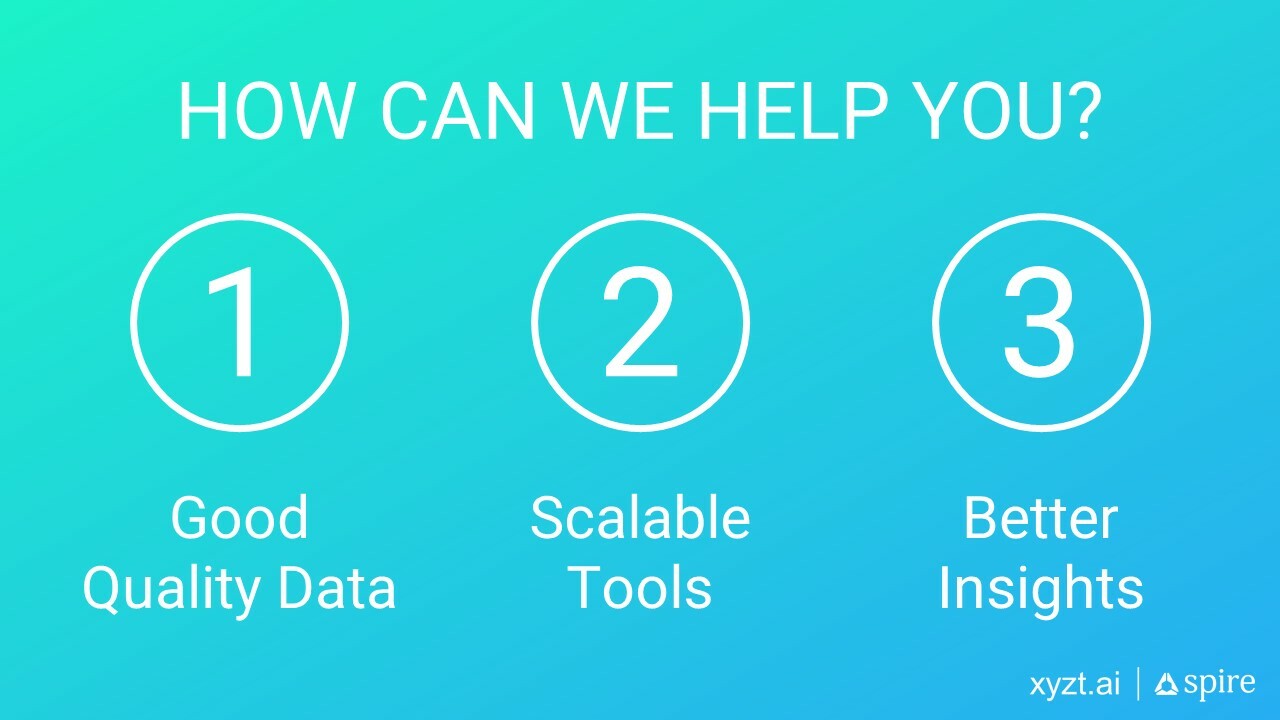
xyzt and Spire can help you by providing the solution to three key points for anyone looking to extract value from data:
- Good Quality Data: AIS data exists in huge volumes and there are many ways data can get bad. For example, spoofing. Spire provides high quality data and makes sure you don’t have to spend time cleaning up the data before the actual analysis.
- Scalable Tools: xyzt provides a platform that scales to billions of records, while remaining interactive, and without you needing to worry about the performance of your device. The use of the platform is not limited to AIS data, it can handle any type of data, as long as it is tracked with a location, timestamp, and attributes.
- Better Insights: xyzt truly believes that the combination of good quality data with an interactive tool, that allows you to move around in the data, is essential to finding new opportunities and extracting better insights.
Mark Deverill, Senior Manager at Spire: “I have been analyzing AIS data for a long time now, and this tool is just incredible how easy it makes to not only analyze the data but to visualize the analysis as well as to do dynamic on-demand kind of analysis of very large volumes of data. It is truly unique in its capability.”
More info on xyzt.ai and Spire
xyzt.ai
xyzt.ai is a big data visual location analytic platform at scale, founded at the beginning of 2019. The platform is a Software-as-a-Service. Meaning, it runs in the cloud and you can either access it from your computer or smartphone. The platform efficiently scales to billions of records, while being interactive, and without you needing to worry about the performance of your device. Everyone can use xyzt.ai. Analyzing your data is as simple as drag and dropping a CSV file. You don’t need to be a data scientist or a geospatial analyst. You can take your data live in less than a day. There is no need for any custom development or complex integration. xyzt.ai is a true self-service analytics tool, with integrated onboarding and extensive solution-oriented capabilities.
Spire
Spire is a leading satellite data company and provides global data for many industries; maritime, aviation, earth intelligence, and more. They own the biggest commercial satellite constellation in the world with 96 private satellites in operation. Mark Deverill notes how Spire has grown exponentially in the last 2-3 years and continues to expand its operations by growing its satellite network and its coverage. Through their active expansion and their custom processes filtering raw to high-quality data, they are able to provide a leading service to their clients.
Did you miss the webinar? If so, don’t worry, click on the image below to register and request access to watch it.
Get Started Today!
Contact xyzt.ai to see how we can help you with your visualization and analysis needs.
