Road authorities already collect enormous amounts of data. Floating vehicle data, traffic counters, road weather information, traffic events, maintenance vehicle data and other sources continuously provide information about what is happening across the road network.
The challenge is not necessarily collecting more data. It is turning that data into information that traffic managers can actually use.
During our recent webinar with Fintraffic, we explored how different traffic and road data sources can be combined to help operators detect unusual situations, understand changing conditions and respond more effectively.
Fintraffic is putting this approach into practice as part of its work on the digitalization of road traffic management in Finland. Together, we looked at several operational use cases, from identifying traffic anomalies to monitoring winter maintenance and combining road and weather information.
In short: Fintraffic combines traffic, weather, road condition, maintenance and event data to give traffic operators a more complete view of what is happening across the road network. This helps teams detect unusual conditions, understand their context and respond with better information.
What is road traffic analytics?
Road traffic analytics is the process of combining, visualizing and analyzing traffic and contextual data to understand what is happening across a road network.
Rather than looking at a single data source in isolation, road authorities can combine information such as:
- floating vehicle data
- traffic counting data
- traffic events
- road safety alerts
- weather information
- satellite data
- road condition information
- maintenance vehicle locations and activities
The value comes from putting these datasets into context.
A traffic speed measurement, for example, can tell you that vehicles are moving slowly. Combining that information with historical traffic patterns, weather conditions, road events or nearby maintenance activities can help explain why speeds have changed and whether the situation requires attention.
That is an important distinction for traffic management. Operators do not need another screen telling them that the morning rush hour is happening as expected. They need to know when something is different.
Moving from monitoring everything to finding what matters
One of Fintraffic's key use cases is detecting unusual patterns across the road network.
Traffic management centers already know what normal conditions look like. Regular congestion at predictable times is not necessarily something that requires additional attention.
The more useful question is:
Where is traffic behaving differently from what we would normally expect?
For Fintraffic, this means using different datasets to identify situations that stand out and presenting them visually to traffic management personnel.
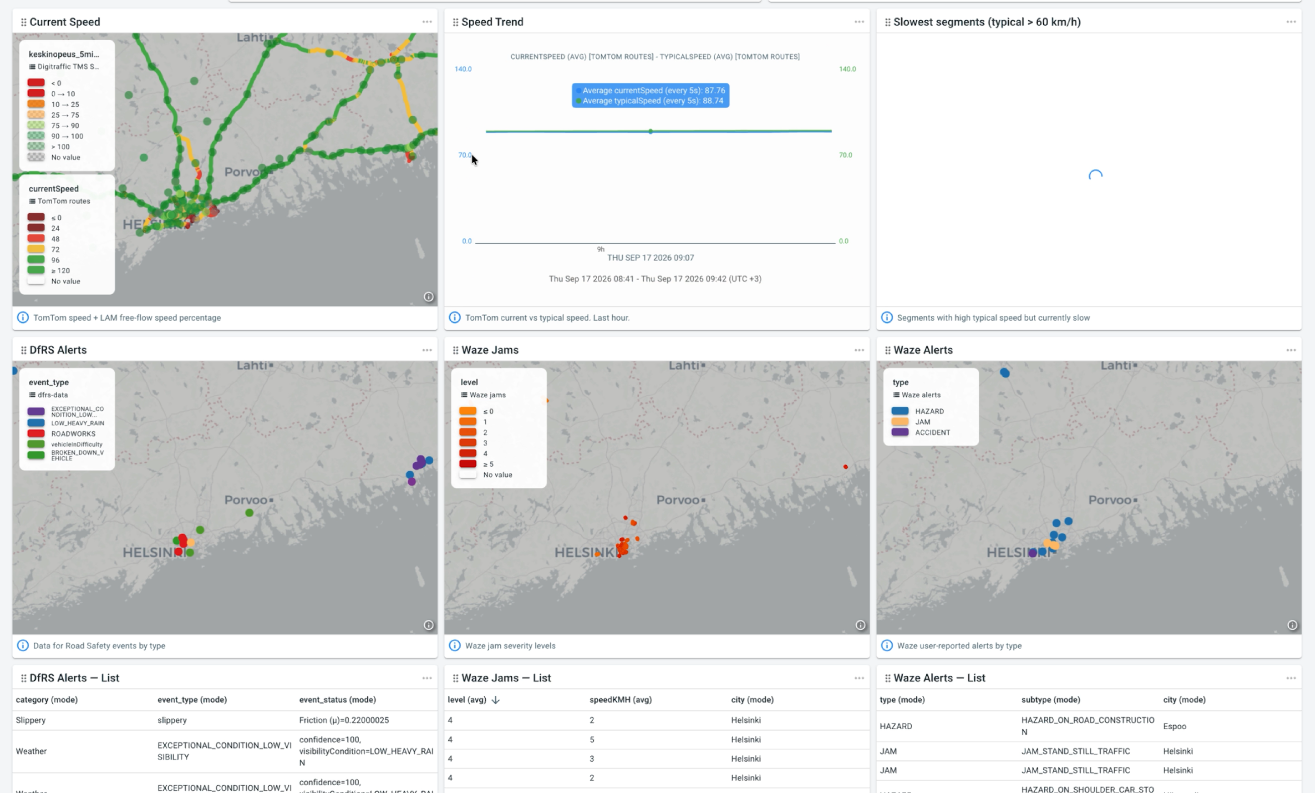
One example shown during the webinar compares current traffic speeds with expected conditions. Road segments where traffic would normally move above a certain speed can be highlighted when the current speed falls significantly below that level.
Instead of requiring operators to inspect every road segment individually, the analytics environment helps draw attention to the locations that may require further investigation.
Fintraffic has been using this type of control room visualization in its traffic management centers, allowing operational teams to provide feedback and continuously refine the views.
👉 Interested in watching the full webinar? You can download it here.
Combining traffic data gives operators more context
A recurring theme throughout the webinar was the importance of combining datasets.
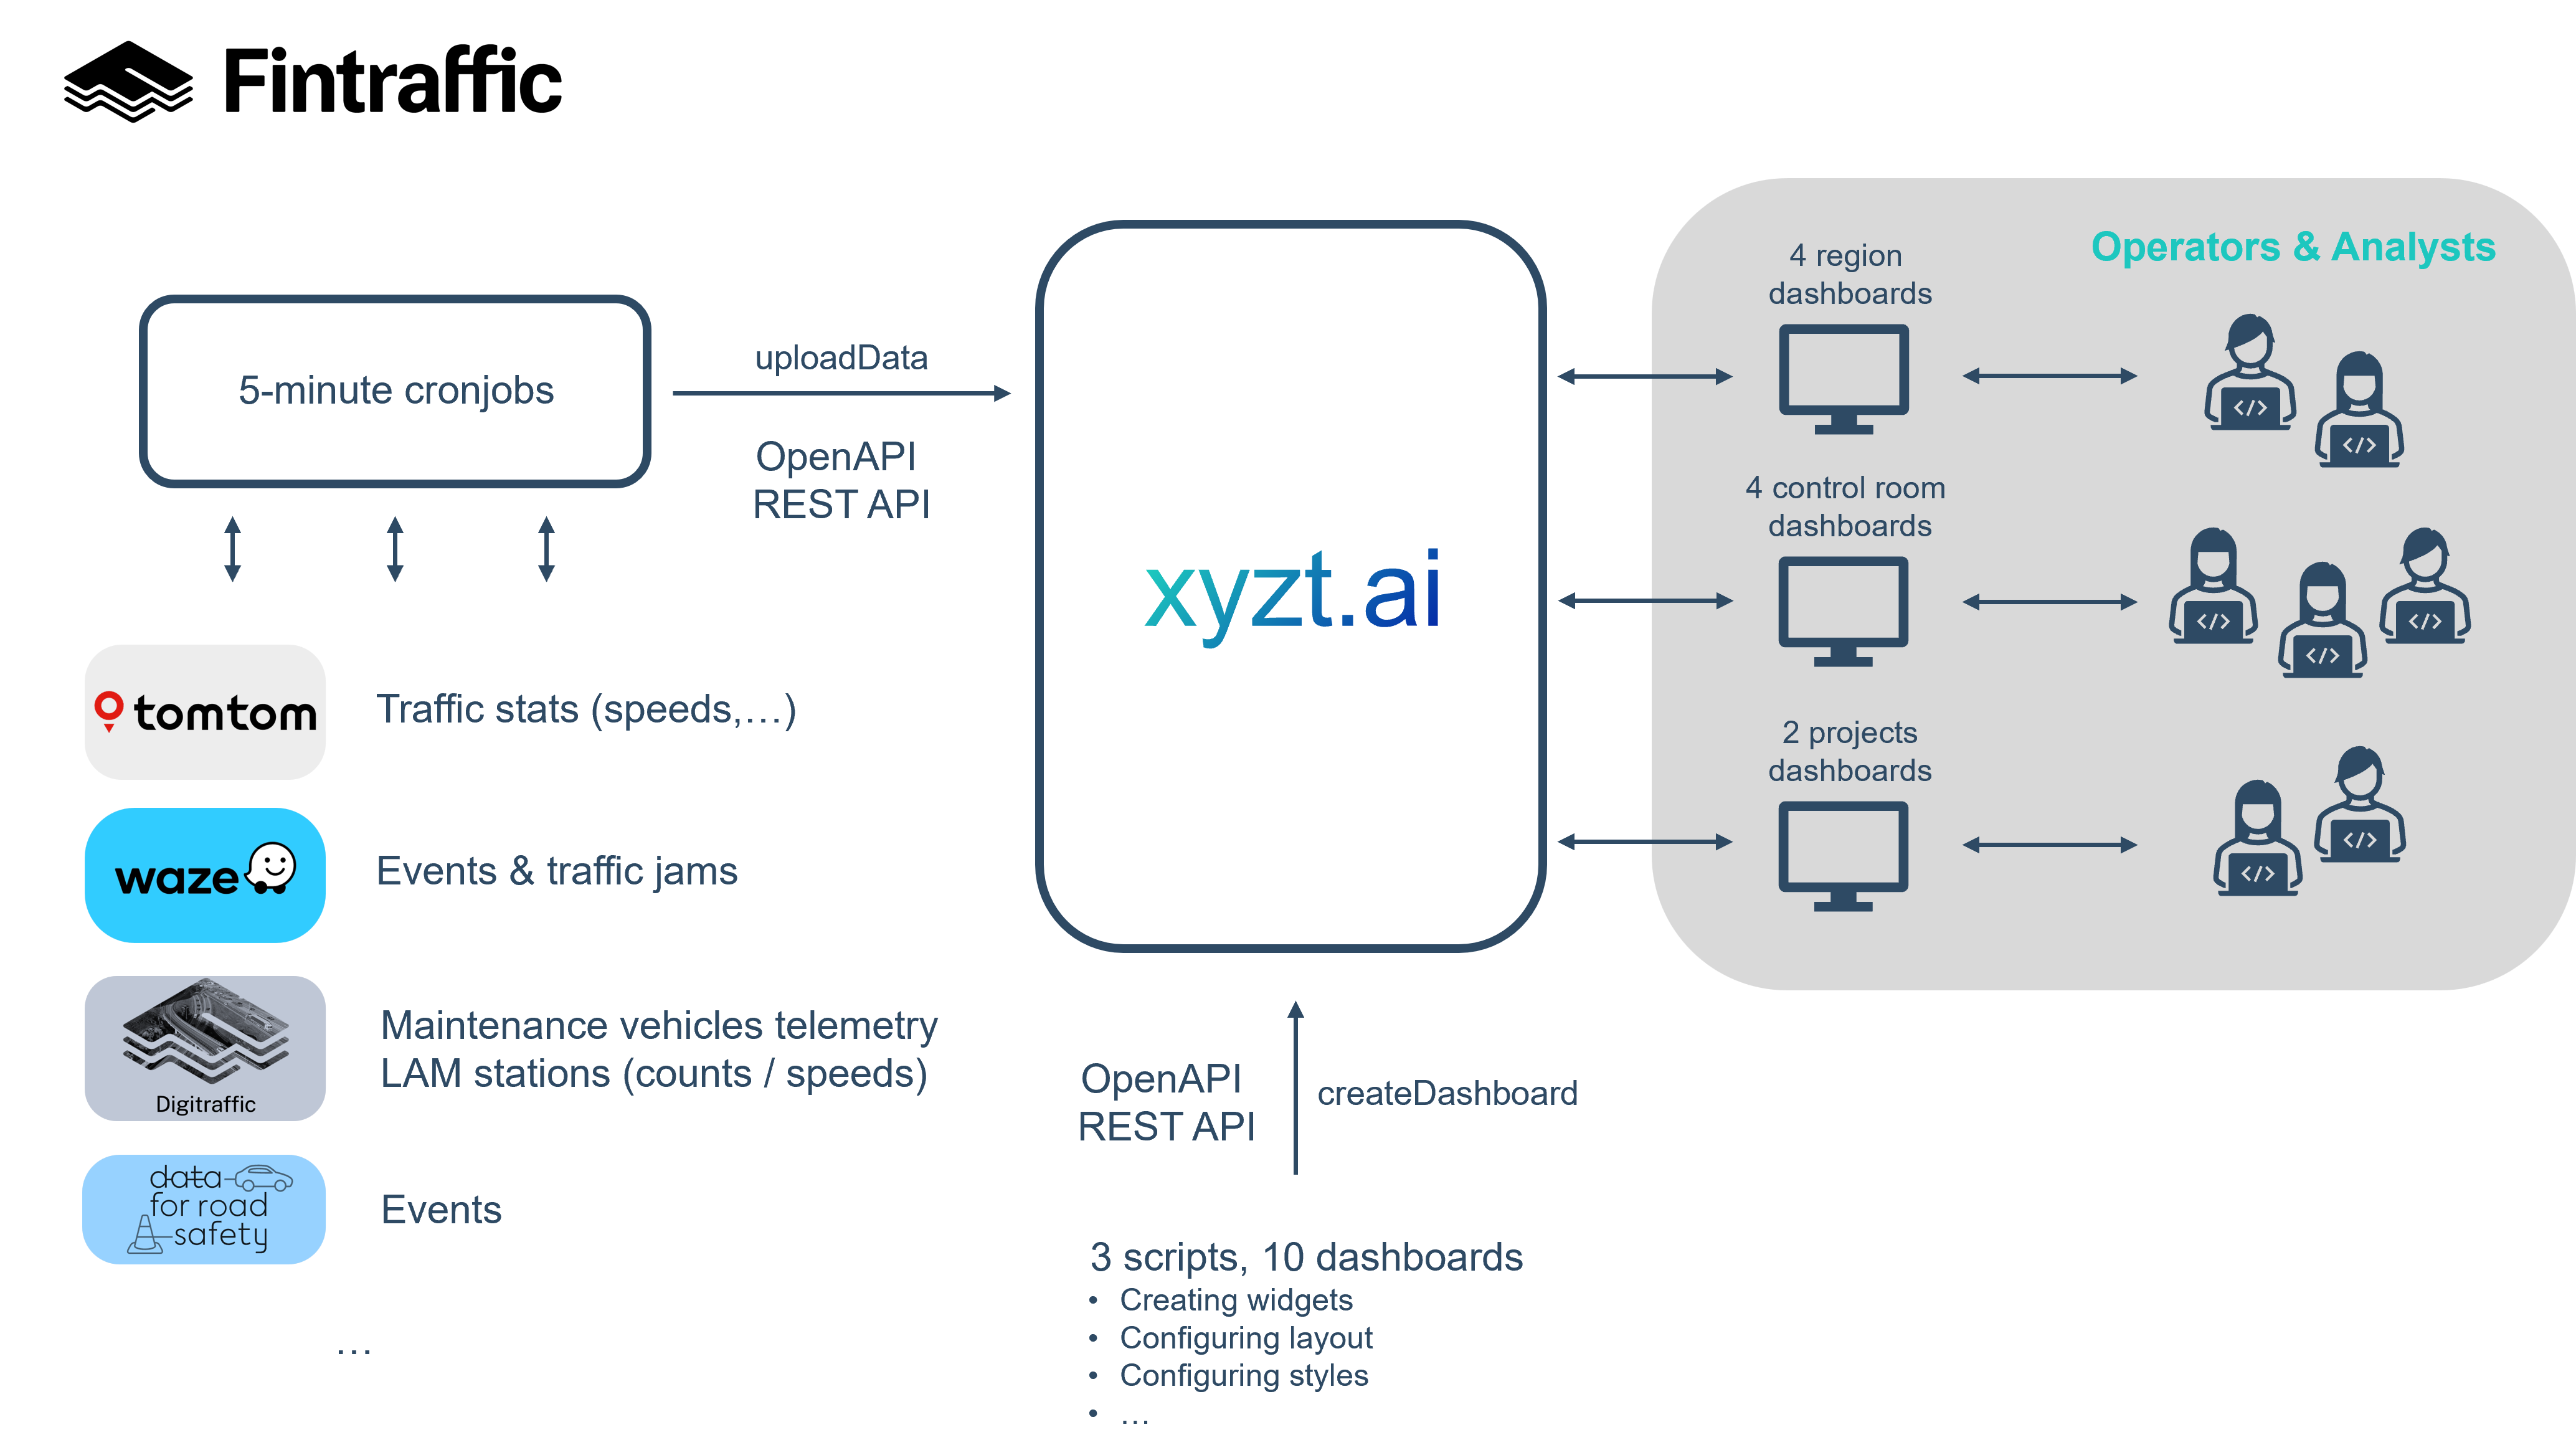
Fintraffic works with information from several sources, including TomTom floating vehicle data, traffic counting stations, road safety information, Waze data, maintenance vehicle information and weather sources.
Bringing those sources together makes it possible to compare what different datasets are showing.
For example, floating vehicle data can provide broad information about road speeds and traffic conditions. Traffic counting stations can provide measurements from specific locations on the network.
Viewing both together helps operators understand the traffic situation from different perspectives rather than relying on one source alone.
This becomes particularly important when considering data quality.
Floating vehicle data providers do not necessarily disclose the exact number of vehicles represented in a dataset. Fintraffic therefore also looks at confidence information provided with the data and can filter out observations below a chosen confidence level.
Where traffic measurement stations are available, their speed measurements can also be displayed alongside floating vehicle data for comparison.
The objective is not simply to put more data on a dashboard. It is to use complementary data sources to build a more complete picture of what is happening on the road network.
Making road weather data operational
Weather is an especially important part of traffic management in Finland.
Winter conditions can vary significantly across the country, and changing weather means road maintenance teams need accurate information about where action is required.
Fintraffic is therefore working towards increasingly detailed information about weather and road conditions.
One of the examples presented during the webinar combines different sources of weather information with road condition data.
Instead of analyzing weather information separately from the road network, operators can visualize weather conditions together with calculated road condition values. Radar and satellite information can provide additional context.
The result is a more holistic view of how weather is developing and what that potentially means for different parts of the road network.
For road operations, this kind of context can be particularly useful when deciding where winter maintenance resources need to be deployed.
Seeing where road maintenance is actually happening
Knowing that a maintenance vehicle has been dispatched is different from knowing where it is and what it has already done.
Fintraffic wanted its traffic management teams to have better visibility into road maintenance activity.
Maintenance vehicle data can therefore be visualized spatially, including the type of task being performed. Because the platform retains the temporal dimension of the data, operators can also see the route a vehicle has travelled rather than only its current position.
That makes the information considerably more useful.
During winter, for example, road users may contact a traffic management center because a road has not yet been cleared. With visibility into maintenance vehicle movements, an operator can see whether a snowplow is already approaching the area or has recently completed work there.
The data can also be used retrospectively.
By combining maintenance activities with traffic information, teams can investigate questions such as whether particular roadworks or maintenance activities affected traffic speeds.
This illustrates an important characteristic of spatial-temporal analytics: the current situation and the historical context can be analyzed in the same environment.
Monitoring the impact of major infrastructure projects
The webinar also demonstrated how the same approach can be applied to a major tunnel construction project.
Fintraffic created a dedicated dashboard to understand what was happening around the construction area and how nearby roads were being affected.
Different datasets can be displayed together, including traffic speeds, counting station information and road safety events.
Crucially, these views are not limited to observing current conditions.
As construction progresses, Fintraffic can compare conditions during different periods. That makes it possible to investigate how traffic patterns around the project change over time.
This type of before-and-after analysis can help move infrastructure monitoring beyond static reporting towards continuously available traffic intelligence.
From multiple data feeds to operational dashboards
Combining many different data sources often sounds like a major integration project.
For the Fintraffic implementation, data is connected to xyzt.ai through APIs. Independent processes retrieve information from the original sources and push updated data into the platform.
That includes both external sources and Fintraffic's own data.
The dashboards themselves can also be created programmatically. Fintraffic operates across different regions, and several dashboards use the same structure with different geographic configurations.
Instead of manually rebuilding each dashboard, their configuration can be scripted and reused.
At the same time, the system is not a closed black box. Fintraffic's own technical teams can modify scripts and dashboards themselves when requirements change.
That flexibility is particularly important in operational environments because the first dashboard rarely remains the final dashboard.
Traffic management personnel provided feedback on what information they wanted to see, how situations should be highlighted and how different elements should be displayed. The dashboards could then be iterated accordingly.
Real-time and historical traffic analytics belong together
Traffic analytics is sometimes divided into two separate worlds.
There is real-time monitoring for traffic management centers, and there is historical analysis for planners and analysts.
In practice, the distinction is becoming much less useful.
Fintraffic's use cases demonstrate why.
A traffic operator may need real-time data to understand what is happening now. But determining whether something is unusual often requires historical context.
A maintenance vehicle's current position is useful. Its route over the previous hours can be more useful.
Current traffic speeds can show congestion. Comparing them with previous periods can help determine whether the situation is normal.
By keeping the temporal dimension available, the same environment can support both immediate operational monitoring and deeper analysis.
Detect, understand and respond
The objective of traffic analytics is ultimately not to produce more dashboards.
It is to help people make better use of the data they already have.
For road authorities and traffic management organizations, that means being able to:
Detect unusual traffic conditions and events earlier.
Understand what is happening by combining traffic information with weather, maintenance, road events and other contextual data.
Respond with better information available to traffic operators and decision-makers.
Fintraffic's work shows that there is significant value in connecting datasets that traditionally exist in separate systems.
The data is often already available. The next step is making it accessible, visual and interactive enough for the people responsible for managing the road network to use it.
Frequently asked questions
What data can be combined for road traffic analytics?
Road traffic analytics can combine floating vehicle data, traffic counting stations, traffic events, road safety alerts, road weather information, satellite data, road conditions and maintenance vehicle information. Combining these sources gives traffic operators more context than analyzing each dataset separately.
How can traffic analytics help traffic management centers?
Traffic analytics can help operators identify unusual road conditions, investigate why traffic is changing and monitor operational activities such as road maintenance. Instead of monitoring every situation equally, teams can focus attention on conditions that differ from normal patterns.
How can floating vehicle data be combined with traffic counter data?
Floating vehicle data provides traffic information across larger parts of a road network, while traffic counters provide measurements at specific locations. Viewing the two together allows road authorities to compare datasets and better understand the traffic conditions being observed.
Why is historical data important for real-time traffic management?
Historical information provides context for current conditions. It helps operators determine whether congestion or a speed reduction is expected or unusual. Historical movement data can also show where maintenance vehicles have already operated rather than only displaying their current position.
How can weather data improve road traffic management?
Combining weather information with road condition and traffic data can help traffic managers understand how changing weather affects different parts of the road network. This is particularly useful for winter road operations, where maintenance resources need to respond to rapidly changing conditions.
Can traffic dashboards combine data from different providers?
Yes. In the Fintraffic implementation, data from several external and internal sources is connected through APIs and brought together in shared dashboards. This allows operators to analyze different datasets within the same visual environment.
What is the role of xyzt.ai in Fintraffic's road traffic analytics?
xyzt.ai acts as the movement intelligence layer in these use cases. Different traffic, weather and operational datasets are connected to the platform so they can be visualized and analyzed together through interactive dashboards, supporting both real-time monitoring and historical analysis.
Interesting in watching the full webinar? You can download it here.
Get in touch with us today if you'd like to discuss your mobility analytics project.
You might also like:
Spatial-Temporal Analytics for System Integrators in Mobility
Designing Effective Floating Car Data Analytics Projects
#VisualAnalytics #Mobility #RealTimeData #MobilityAnalytics