
The most effective floating car data analytics projects do not start with a procurement list or a technical setup. They start with clarity. What decision needs to be supported? What type of traffic data analysis is required? What level of spatial and temporal detail actually matters?
These are the questions that separate valuable mobility analytics from expensive experimentation.
During our latest xyzt.ai webinar, we outlined a practical, framework on how to design floating car data analytics projects that deliver real, lasting insights.
What can floating car data analytics deliver?
Floating car data is widely used in mobility analytics and transportation analytics to understand how vehicles move across a network.
Common floating car data use cases include:
- travel time analysis and speed monitoring
- congestion analysis and traffic monitoring
- origin-destination analysis
- route choice analysis
- network performance benchmarking
- before-after analysis of traffic interventions
These applications support key transportation decisions. For example, teams can analyze how congestion evolves throughout the day, how travel times vary across corridors, or how traffic patterns change after infrastructure updates.
Floating car data analytics is especially valuable for understanding patterns, trends, and relative changes in traffic behavior.
Floating car data is a sample, not a full traffic count
A critical concept in floating car data analytics is that the data represents a sample of traffic, not a complete census.
Coverage varies depending on geography, road type, and user behavior. Highways often have stronger representation than local roads, and long-distance trips may be better captured than short local journeys.
This has direct implications for traffic data analysis.
Floating car data is highly effective for:
- comparing traffic conditions over time
- identifying congestion patterns
- analyzing relative changes in speed or flow
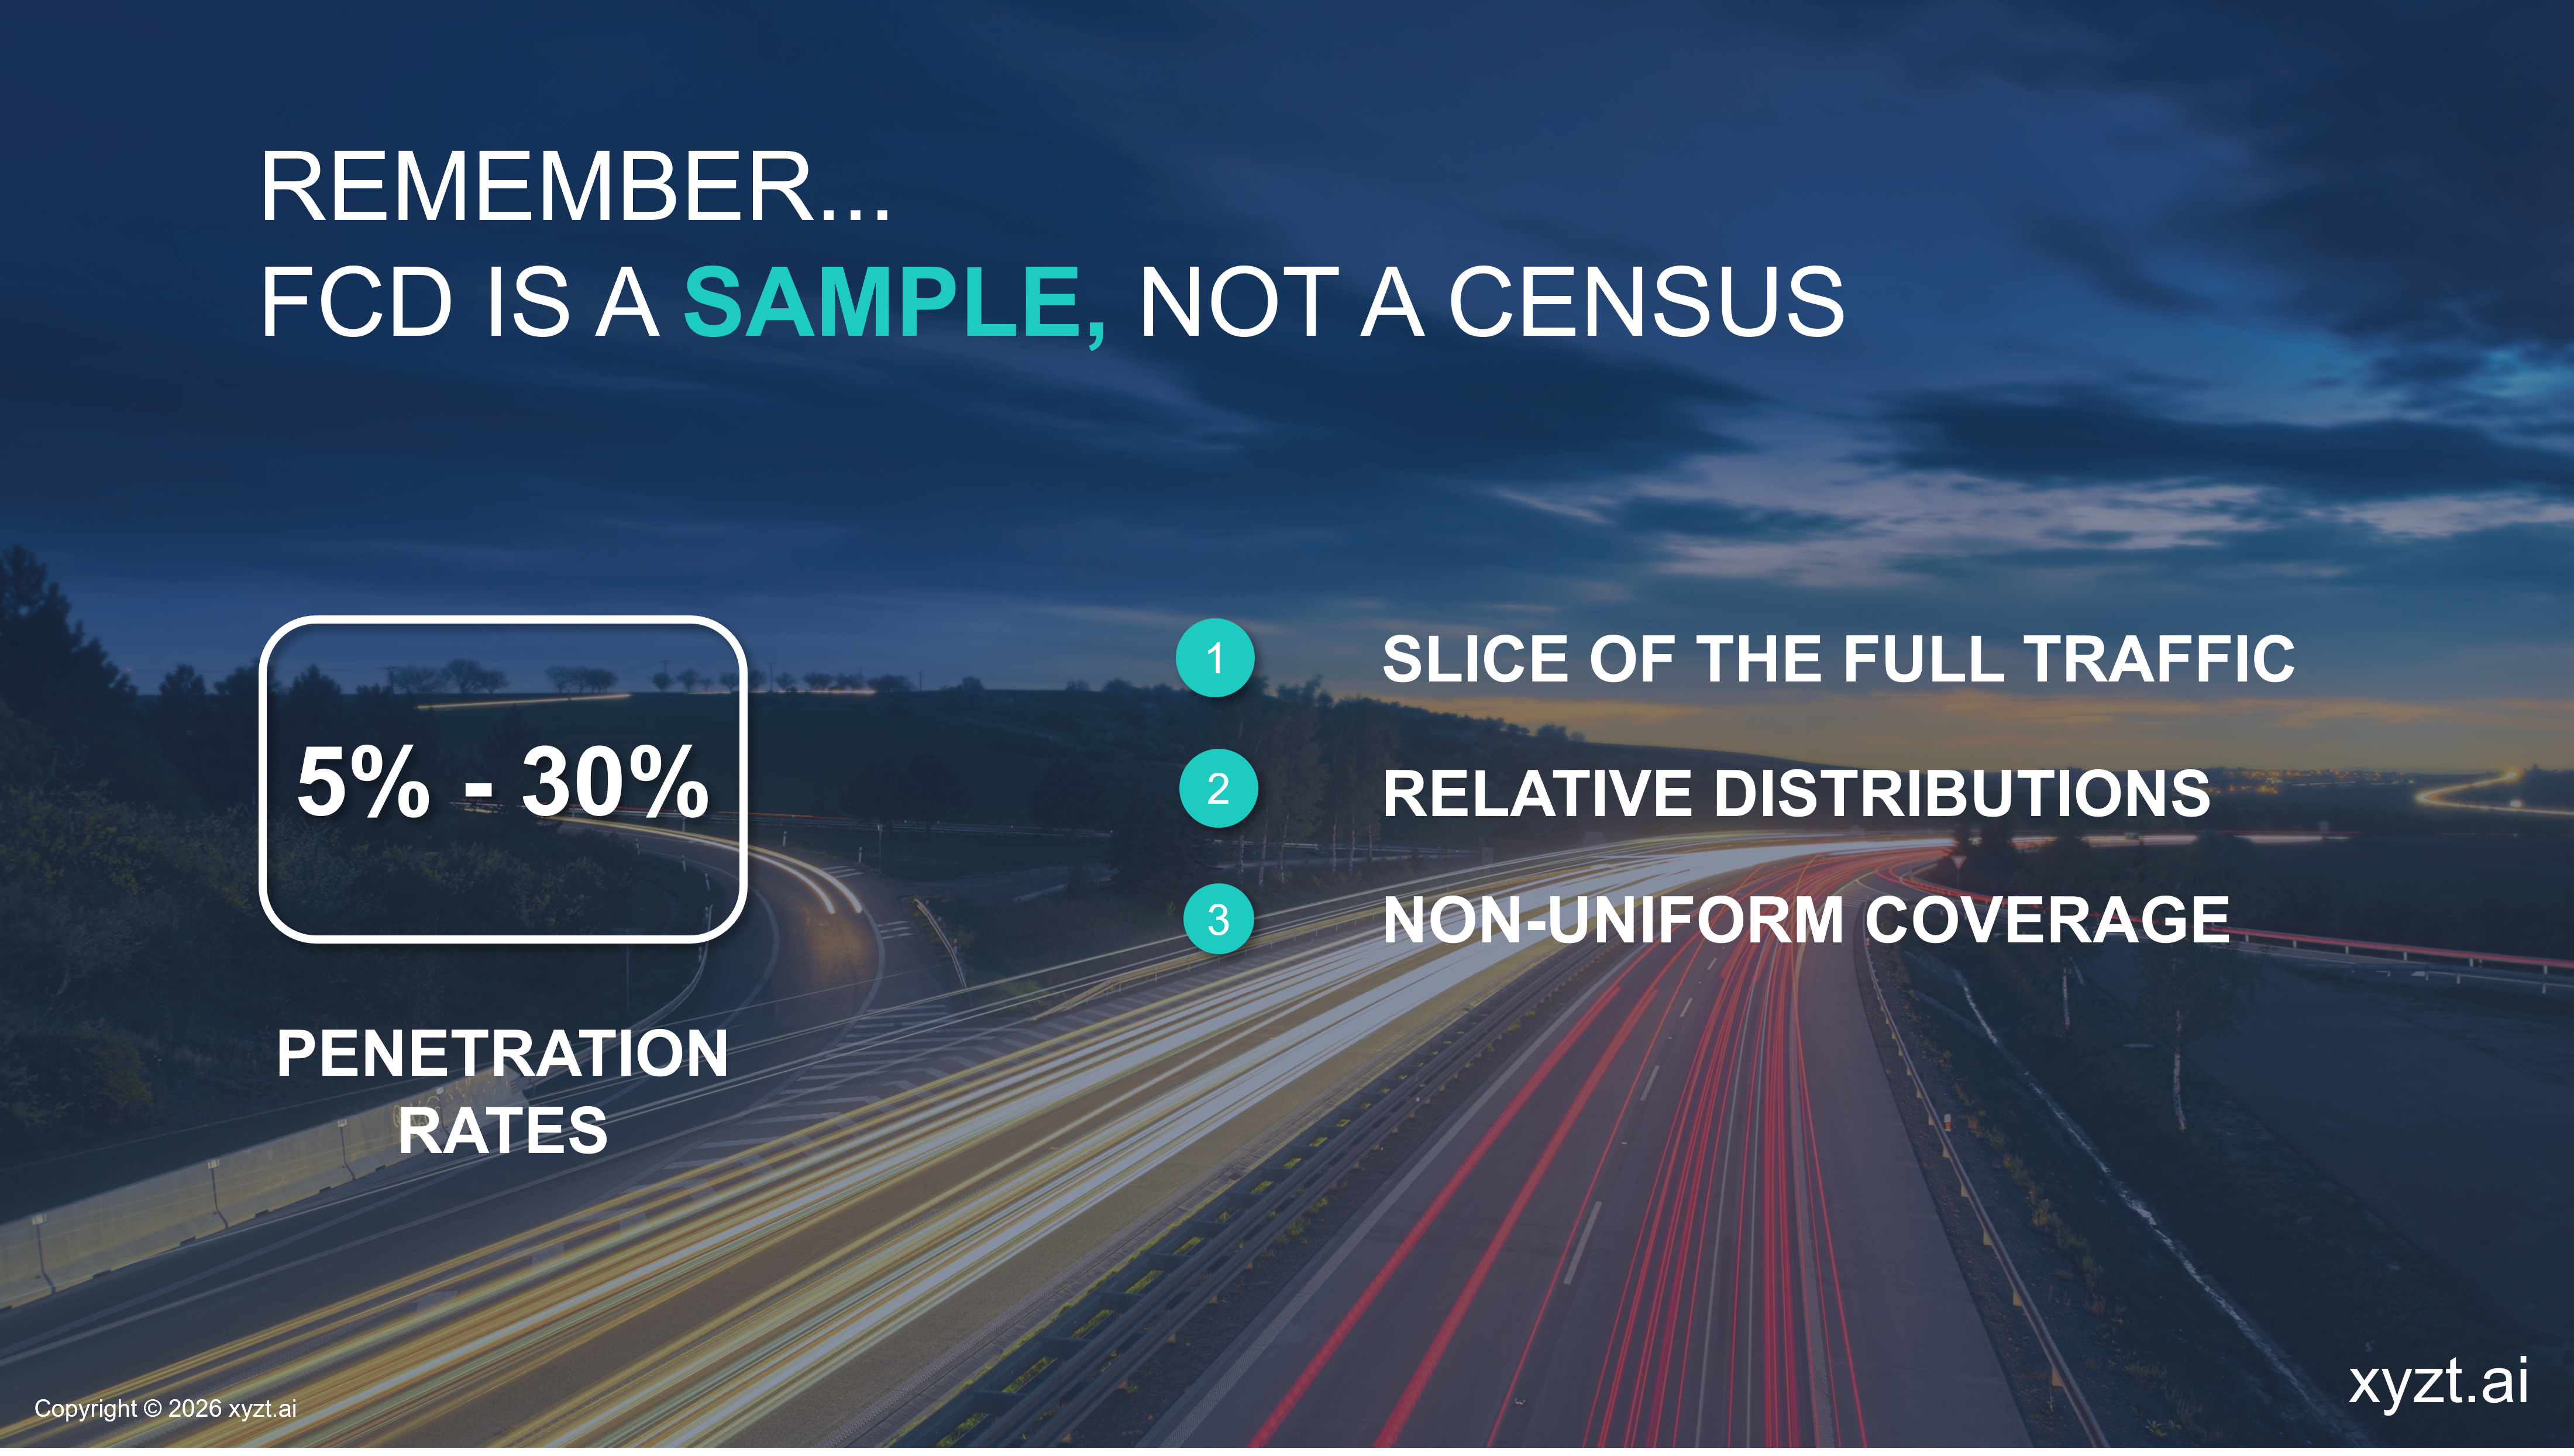
However, it is not inherently designed to provide absolute traffic counts without calibration.
Understanding this distinction is essential when designing a mobility analytics project.
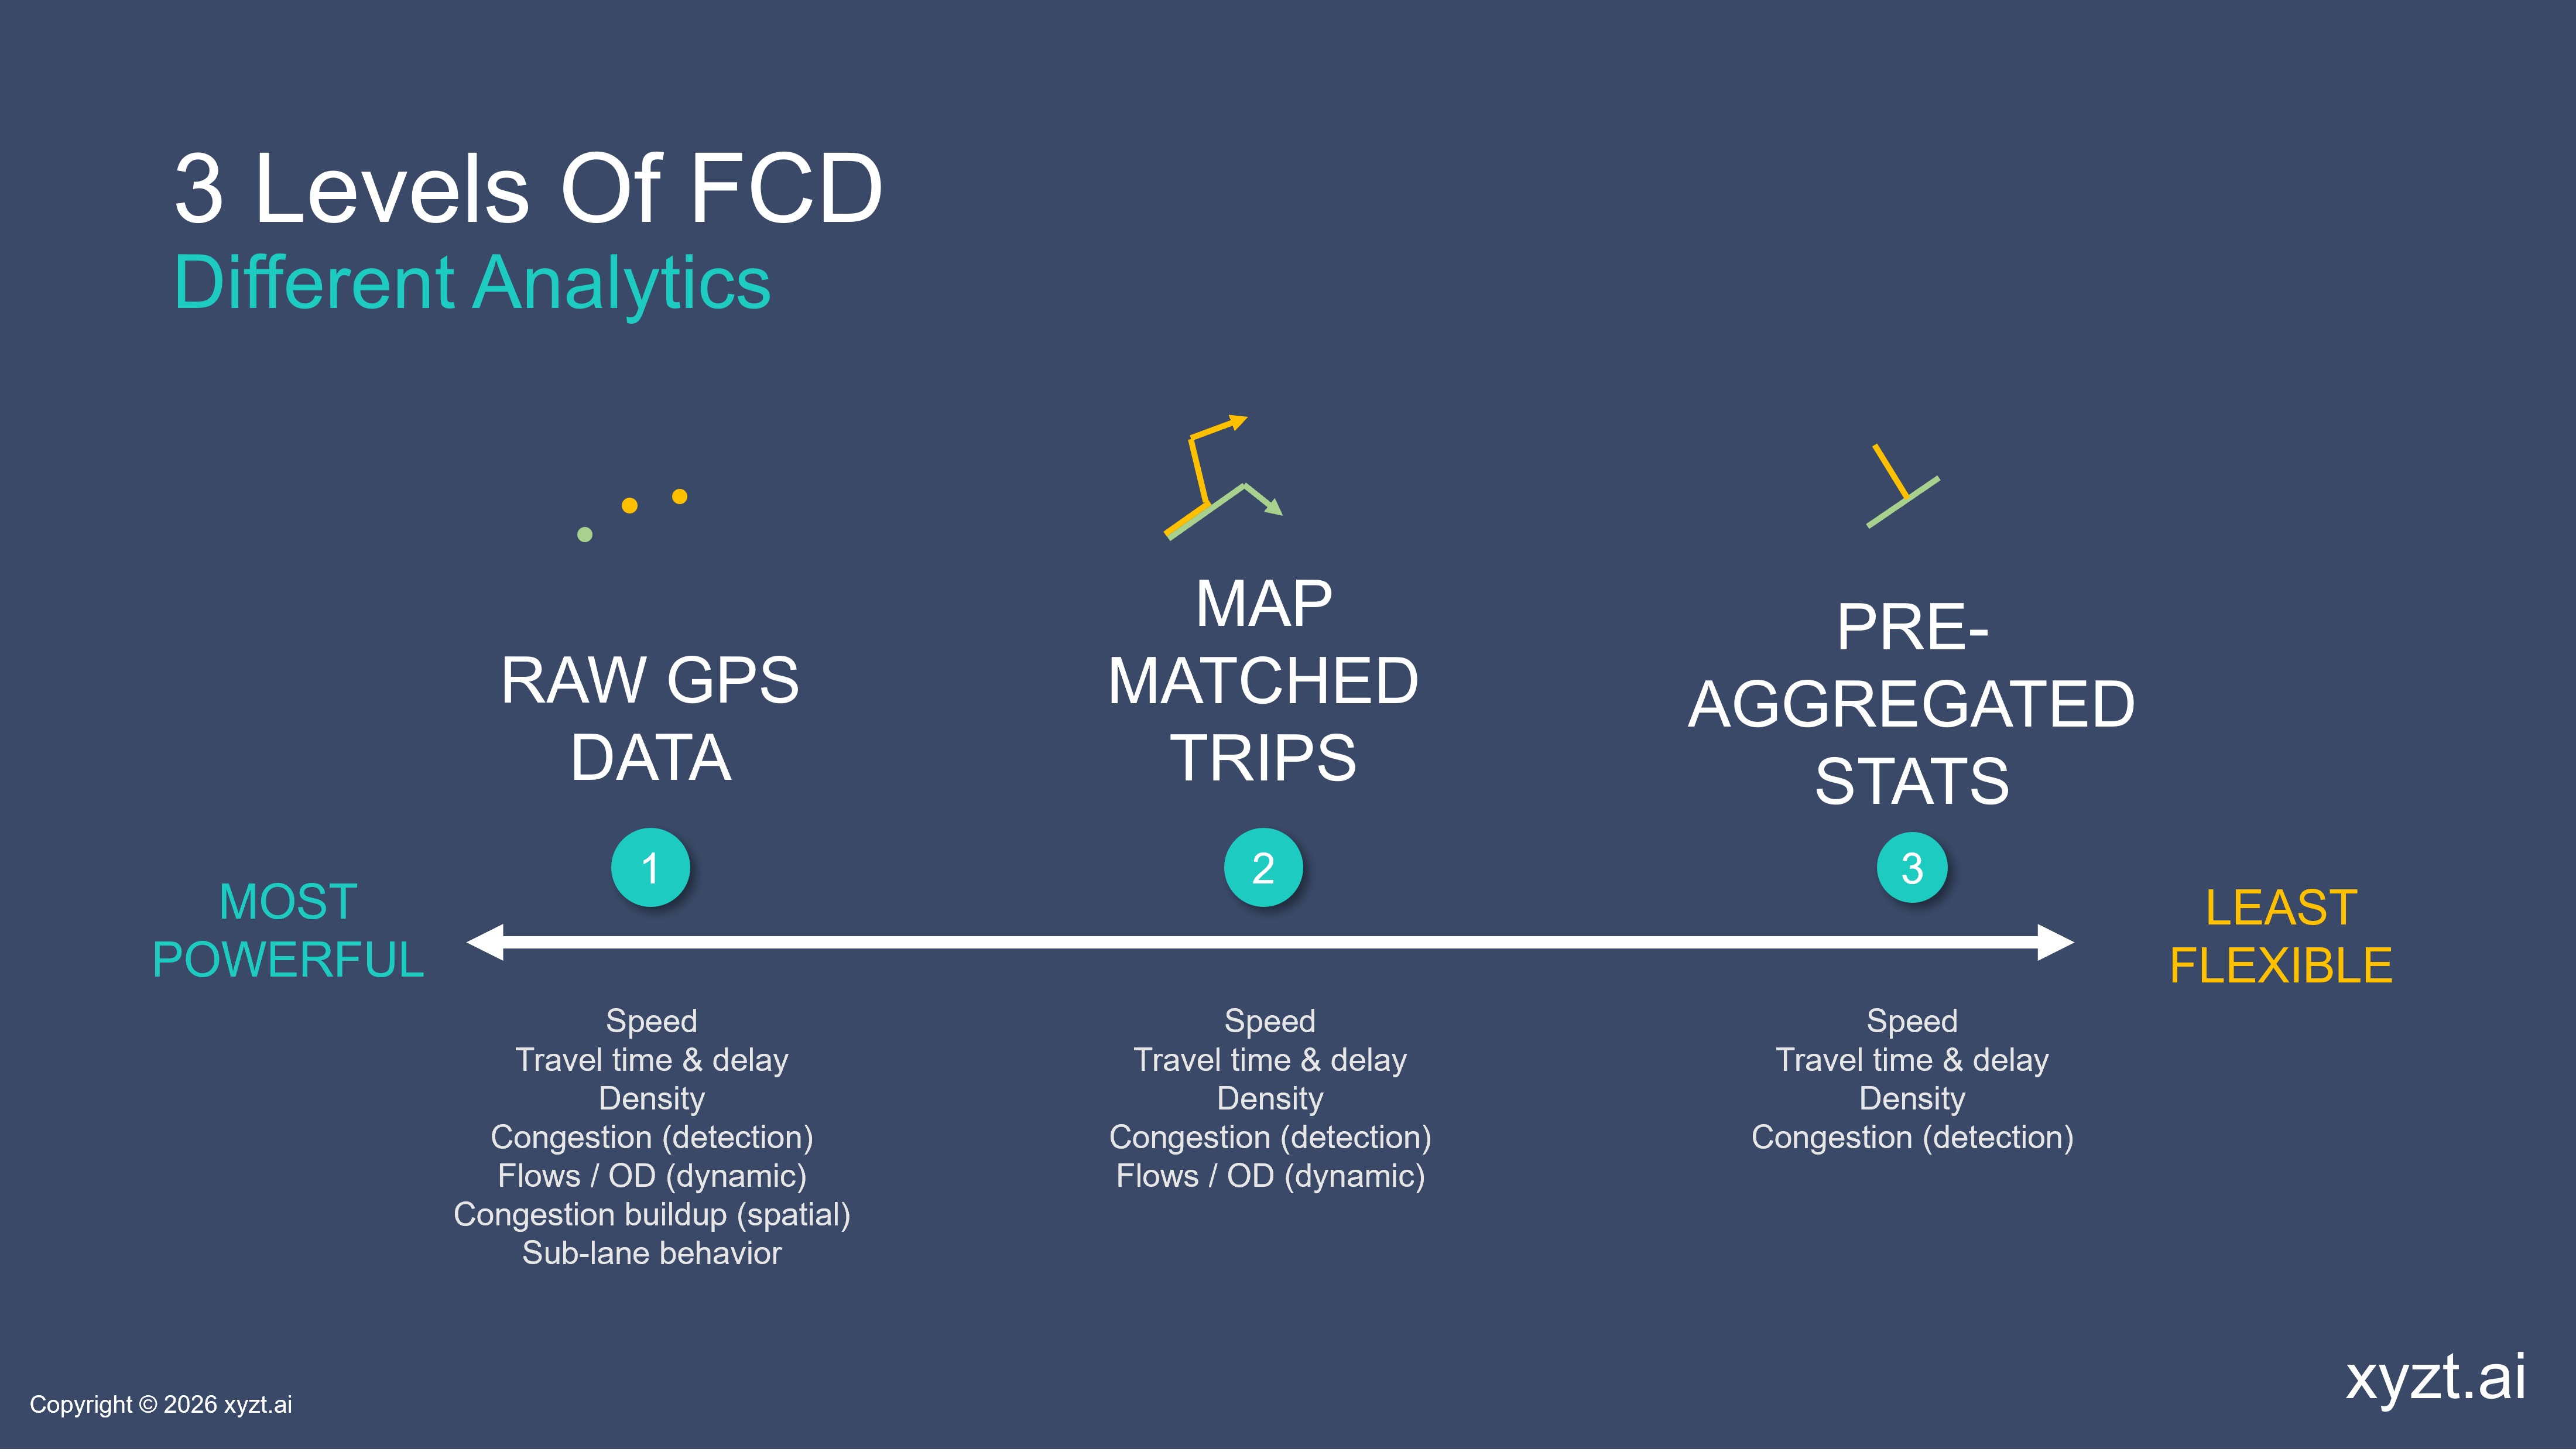
Types of floating car data and their analytics capabilities
Not all floating car data supports the same type of analytics. Choosing the right data format is a key part of designing an effective analytics project.
Raw GPS data for advanced mobility analytics
Raw GPS data is the most detailed form of floating car data. It includes timestamped vehicle locations, speeds, and movement characteristics.
This type of data enables advanced traffic analytics such as:
- detailed route choice analysis
- congestion buildup detection
- high-resolution spatial-temporal analytics
- origin-destination analysis
However, it also requires more processing power, storage, and infrastructure.
Movement path (trips) data for flexible analysis
Movement path data, often referred to as trips data, maps vehicle movements to road segments while preserving route sequences.
It supports a wide range of mobility analytics use cases, including:
- route and flow analysis
- origin-destination analysis
- traffic trend analysis
- density and pattern detection
This makes it a strong balance between flexibility and performance for many transportation analytics projects.
Pre-aggregated traffic data for monitoring
Pre-aggregated traffic data provides summarized metrics such as average speed, travel time, or traffic volume over time.
It is well suited for:
- traffic monitoring
- congestion analysis
- corridor performance tracking
However, it is less flexible for deeper analytics such as route behavior or custom flow analysis.
Why Floating Car Data Analytics Projects fail
Many traffic analytics projects struggle not because of poor data, but because of unclear design.
1. Undefined use cases in mobility analytics
A project may request origin-destination analysis without specifying whether the goal is local traffic analysis or long-distance movement patterns.
Without this clarity, the selected data may not support the intended analysis.
2. Data access limitations
At scale, mobility data analytics requires efficient access to large datasets. API limitations, rate limits, or closed platforms can restrict the ability to perform meaningful traffic data analysis.
3. Underestimated data infrastructure costs
Floating car data can quickly reach terabytes in size. Storage, processing, and performance requirements must be considered early in the project.
More data is not always better. Relevant data is.
How to design a floating car data analytics project
To design a successful floating car data analytics project, three key questions should be answered before starting.
1. What decision should the analytics support?
Every data analytics project should start with a clear decision-making objective.
Examples include:
- evaluating a traffic intervention
- identifying congestion hotspots
- understanding route choice behavior
Without this clarity, it is difficult to define the right data or analytics approach.
2. What mobility scope and spatial scale are relevant?
Mobility analytics can operate at different scales:
- city-level traffic analysis
- corridor-level monitoring
- regional or cross-border movement analysis
Movement path data supports many types of spatial-temporal analytics, including route analysis, origin-destination flows, and trend analysis. However, it is important to align the data format with the required level of detail.
3. What constraints shape the analytics design?
Constraints such as privacy regulations, infrastructure, budget, and internal capabilities must be considered early.
For example:
- data storage and processing capacity
- integration with existing systems
- need for cloud or on-premise deployment
- combining floating car data with other datasets
Designing around these constraints leads to more scalable and effective analytics solutions.
Floating car data analytics playbook (download)
Designing a strong traffic analytics project requires more than theory. It requires a structured approach.
To support this, we’ve created a floating car data analytics playbook that translates these principles into a practical checklist.
The playbook helps you:
- define clear mobility analytics use cases
- validate whether your data supports your analysis
- select the right level of data aggregation
- account for constraints such as privacy, storage, and performance
- avoid common pitfalls in traffic data analytics projects
👉 Download the floating car data analytics playbook to apply these best practices in your own projects.
Making traffic event data easier to analyze
A common challenge in traffic data analysis is interpreting large volumes of event data across a city.
For example, events such as harsh braking or sharp turns can be difficult to analyze when plotted directly on a map.
A more effective mobility analytics approach is to:
- combine event data with contextual layers such as neighborhoods or intersections
- aggregate and rank locations based on event frequency
- use charts and tables alongside maps
This makes traffic patterns easier to interpret and supports better decision-making.
Why open mobility analytics platforms matter
The value of floating car data analytics increases when it can be combined with other data sources.
An open mobility analytics platform allows organizations to:
- integrate multiple floating car data providers
- combine traffic data with sensor or planning data
- expand analytics use cases over time
This flexibility is especially important in regions where data availability varies or where multiple sources must be combined.
The future of floating car data analytics
Several trends are shaping the future of mobility analytics:
- convergence of real-time and historical traffic analytics
- AI-assisted traffic data analysis
- growth of open and connected data ecosystems
Organizations that invest in well-designed analytics foundations today will be better positioned to take advantage of these developments.
Final takeaway
The success of a floating car data analytics project is determined long before the first dataset is analyzed.
When organizations start with clear decisions, select the right data, and design for constraints and scalability, mobility analytics becomes a powerful tool for better transportation outcomes.
If you want a practical starting point, the playbook provides a structured way to get there.
Interesting in watching the full webinar? You can download it here.
Get in touch with us today if you'd like to discuss your mobility analytics project.
You might also like
From Maps to Movement in Time: Why the “When” Changes Everything in Spatial Analytics
From Global AI to Local Impact: Data-Driven Decisions for Saudi Arabia & the UAE