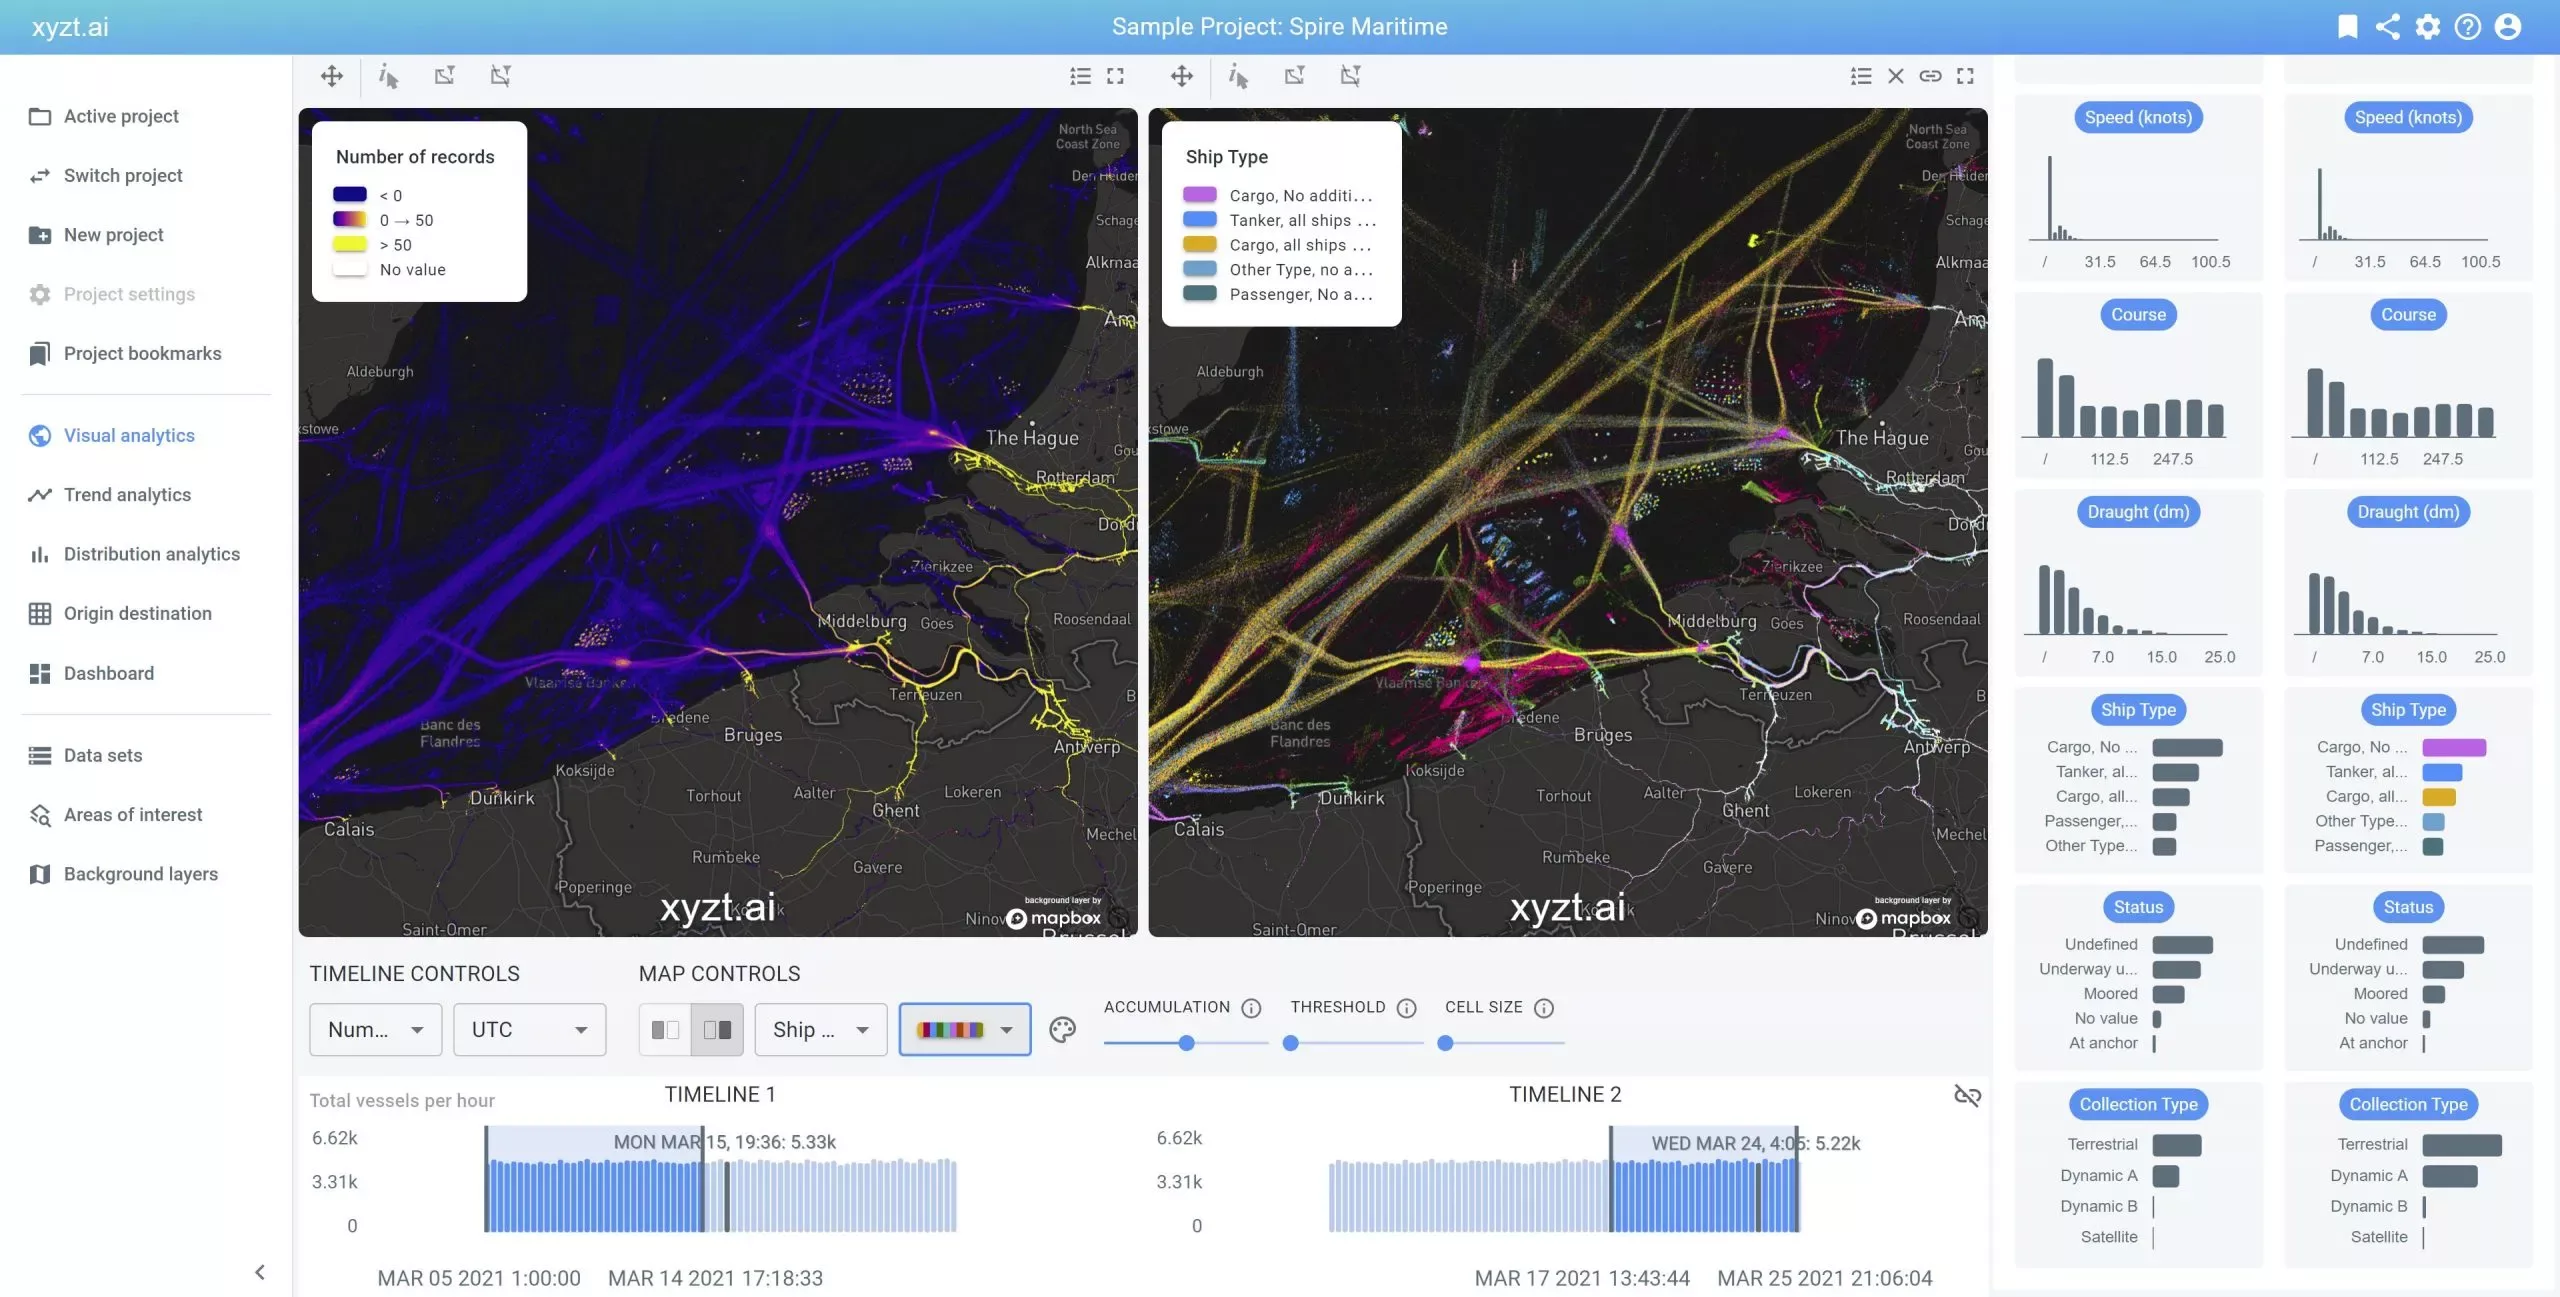
AIS data contains information communicated by vessels to report on their location, status, draught, and so on. AIS stands for Automatic Identification System. Vessels are required to report their position and status at regular intervals. The AIS signals are picked up by antennas onshore, on satellites, and on other vessels.
Knowing where vessels are moving and what they are doing is important to a number of business cases:
So how do you get access to this data? There are a number of options:
- Buy your quality data from companies and organizations that track, clean, and sell data. A good example here is Spire,
- Collect your own data: Using an off-the-shelf antenna, raspberry pi, and some engineering skills you can build your own receiving station and start logging the location of vessels in your neighborhood.
- Search for free data, for example using Google Dataset Search.
A great source of free (historical) AIS data is NOAA office for coastal management. They publish historical AIS data making it accessible through easy-to-download csv files published on an FTP site.
Now that you downloaded this data, how to start using it? Well, here comes the catch. This data is big. Probably too big for the tools that you are using now.
To put this in perspective: A single file covering one day of maritime traffic around Denmark provided by the DMA is about 2GB in size and contains about 10 million location records. This means a month of data is about 60GB and a year of data is about 700GB, covering over 3 billion data points. Just copying this data takes time, let alone trying to visualize, and analyze the data.
Also here there are a number of options to move forward:
- Down-sample: This is what is most commonly done as current GIS tools can only handle a couple million of data points at most. The risk though is that by downsampling you lose exactly what you are looking for.
- Spend hours or days writing (Python) scripts to extract the part of the data you think you are looking for. Again with the risk of leaving out what you are looking for.
- Use a big data tool that is built to deal with this data: a tool that allows to load all the data, visualize and summarize all the data, and at the same time allowing you to drill down and discover the needles you are looking for.
That is exactly what xyzt.ai is: An easy-to-use tool to work with big location data. No development needed, no scripting skills needed, no downsampling needed. Take your maritime AIS data live in a matter of minutes.
The four steps:
Want to know how it works? Discover it here or read our maritime big data analytics use case here.


