No-code analytics platform turning your spatio-temporal data into actionable insights
Easily visualize and analyze any spatio-temporal data. Scaling to billions of records.
Talk to an expert


Where + When
xyzt.ai is at the intersection of spatial and time series analysis, with the ease of a dashboarding tool.
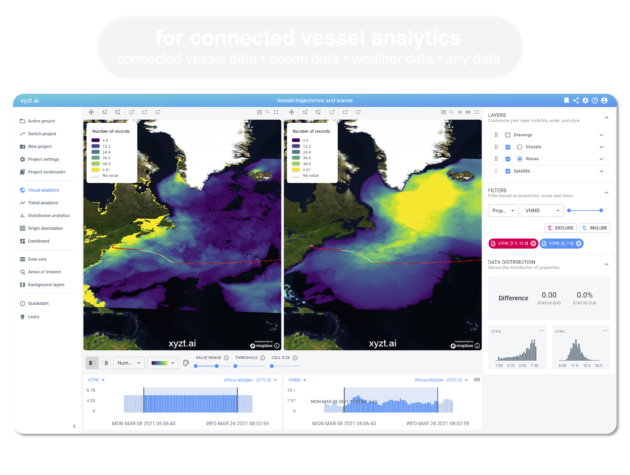
Bring your own data
Connect your own data, combine multiple data sources, and perform layered analysis.

Small & big data
Even if you’re not yet handling big data sets, rest assured that leveraging the xyzt.ai platform has you future proofed.
Monetize today
Take a shortcut to monetizing your data and sensor investments. Work together, embed dashboards, and share reports.


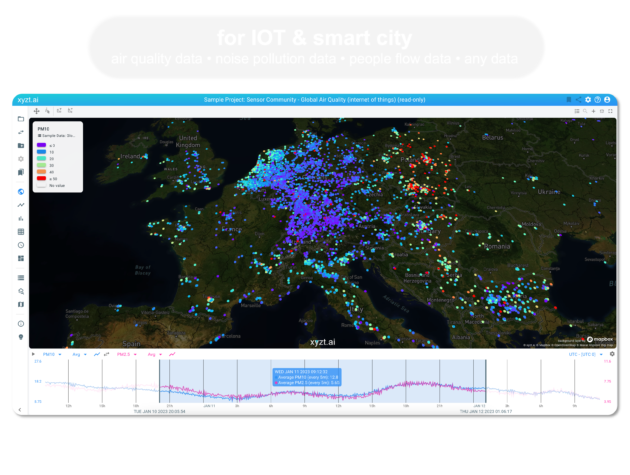
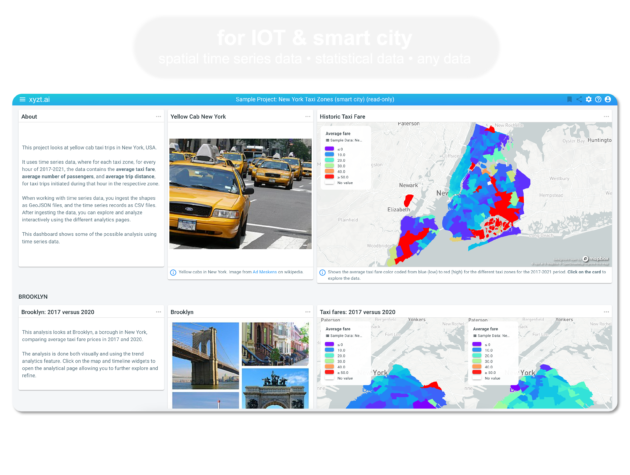
Internet of Things
Focus your time and investments on what you're good at: your sensor hardware. Let xyzt.ai handle the data visualization and analytics.

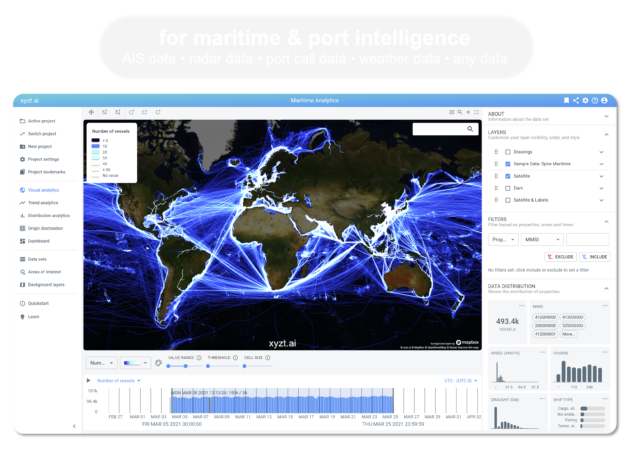
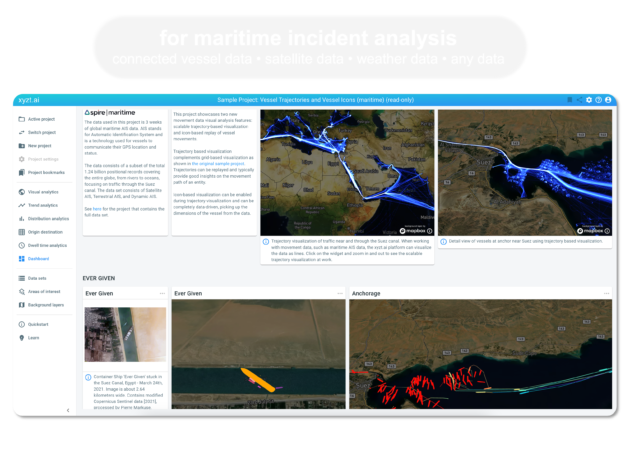
Maritime & Ports
xyzt.ai is used by ports, chemical companies, and government agencies to provide maritime situational awareness to improve port safety and efficiency, to recover lost taxes from maritime trade, and to identify logistics bottlenecks.

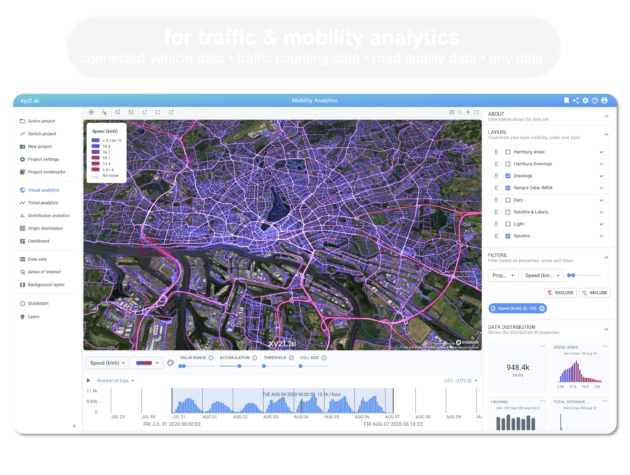
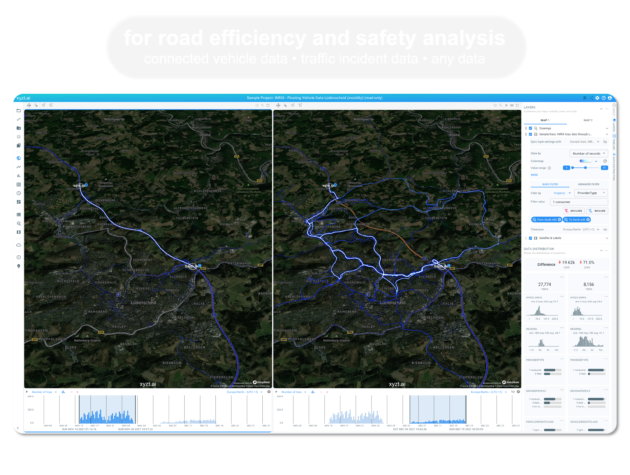
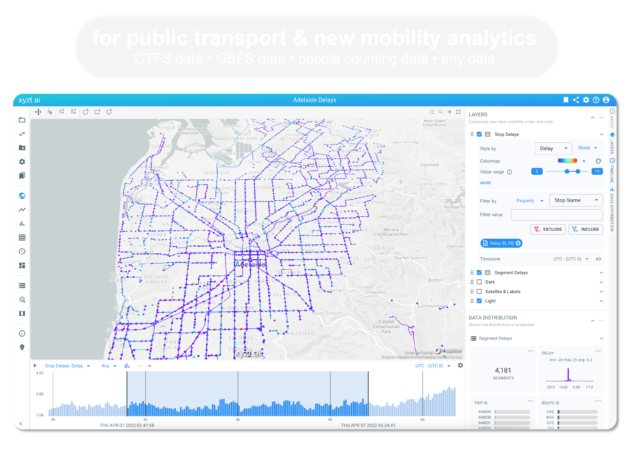
Mobility & Traffic
With xyzt.ai, you can perform your on-demand traffic, mobility, or any other analytics using connected vehicle or other mobility data, instantly. As a bonus, your data never leaves our cloud, ensuring privacy protection.

Any Industry
Whether you are working with data in aviation, mining, crowd control, logistics, environmental,... the xyzt.ai platform is your shortcut for your data monetisation.