Trusted by leading organizations like Autobahn GmbH in Germany and Texas A&M Transportation Institute in the USA, xyzt.ai empowers traffic and mobility professionals worldwide to unlock actionable insights from their data.
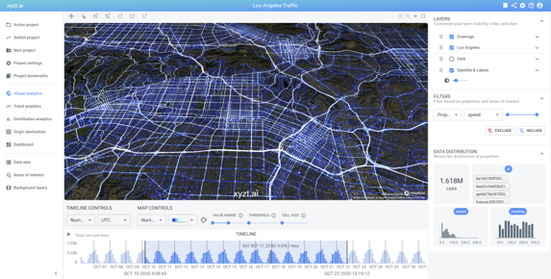
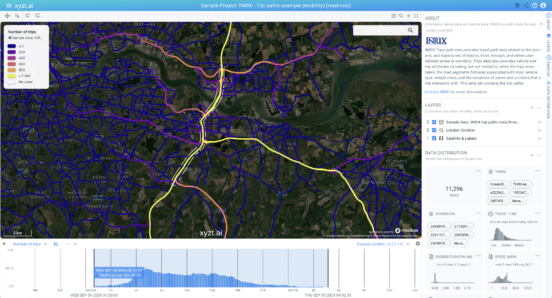
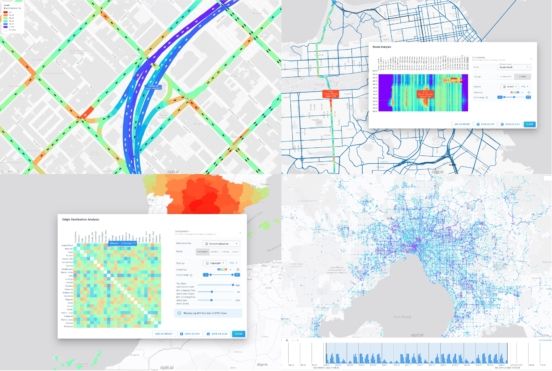
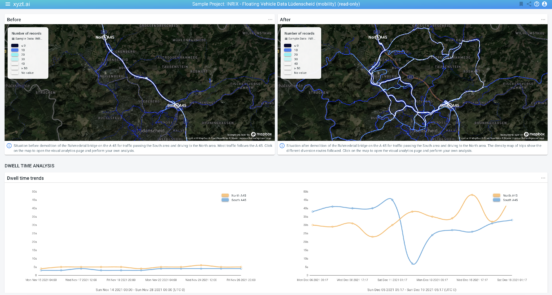
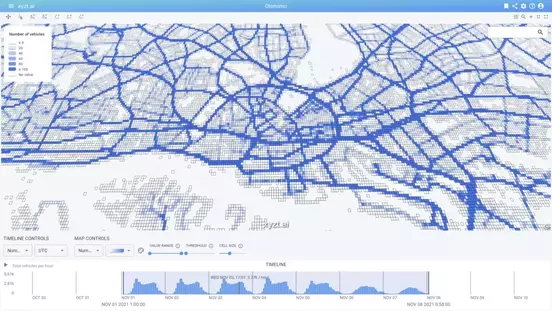
With a unique focus on multi-source spatial and temporal analytics, xyzt.ai seamlessly integrates diverse mobility data, including floating vehicle, traffic counting, and road incident data, to deliver unparalleled clarity and precision.
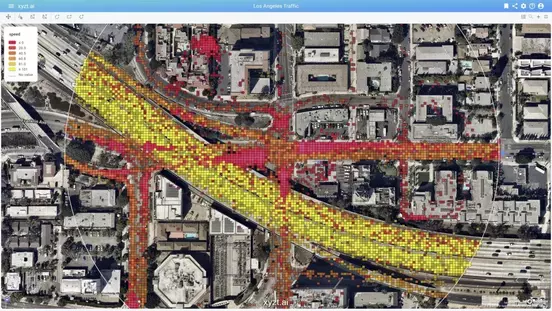
From road authorities to insurance companies, our platform is driving safer roads, cleaner cities, and more efficient transportation networks, helping our partners build a smarter, sustainable future.