Maritime & Ports

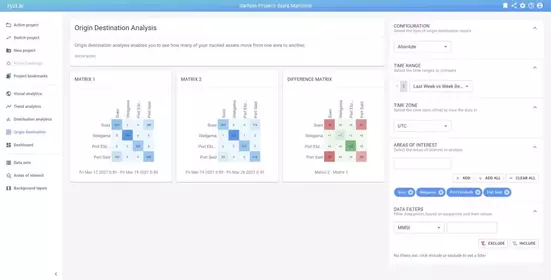
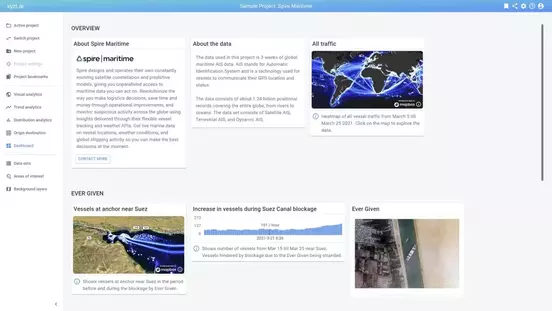
xyzt.ai is used by maritime organizations and port authorities to obtain maritime situational awareness and extract maritime domain intelligence.


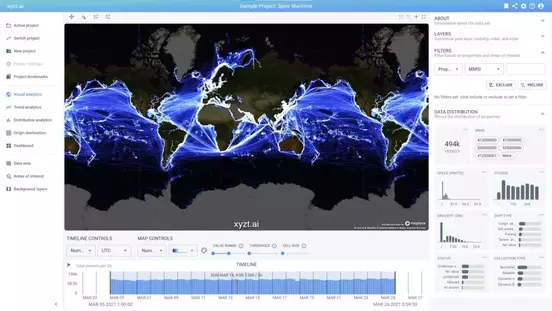
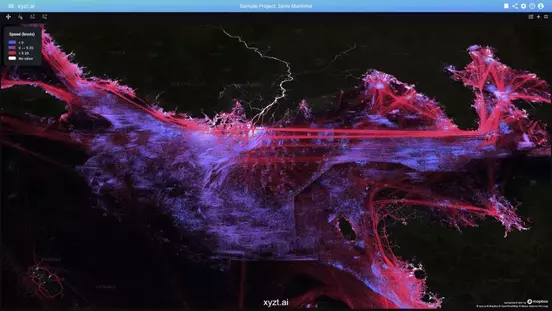
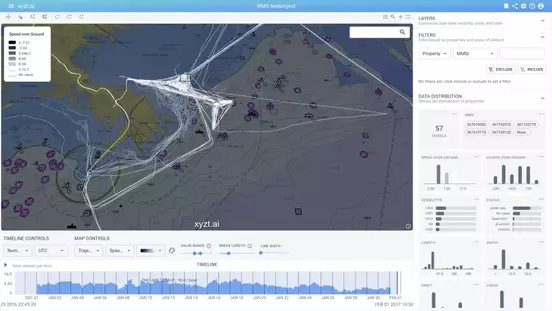
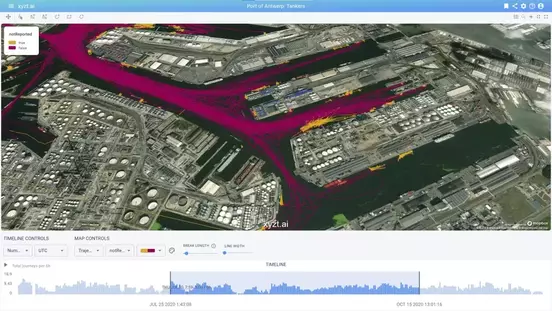
With a unique focus on multi-source spatial and temporal visual analytics, it can handle the most demanding use cases, combining large radar and AIS data sets with weather and ocean data and detailed vessel tracking data.


xyzt.ai is used by major port authorities, government agencies, fleet operators, and chemical companies to obtain safe, secure, and more efficient maritime operations.

Instantly analyze months of maritime traffic data, not just the current situation

Don’t worry about data sizes, we’ve got you covered. The xyzt.ai platform is built on a novel architecture that effortlessly scales to billions of maritime data points, while maintaining a fast update rate for its interactive features. This combination enables big data exploration at the speed of thought for you to gain insights into maritime trends, changes, patterns, … beyond the current situation.

Try for free and test xyzt.ai’s scalability for yourself.

Compatible with maritime data from any vendor such as Spire, ExactEarth, Kpler, Marinetraffic, OHB, Orbcomm,… or bring your own data!

Using xyzt.ai, you can easily upload your own IoT vessel data or any maritime location data from any data vendor. For example, the xyzt.ai platform is fully compatible with dynamic AIS, terrestrial, satellite, and IVEF data from Spire, ExactEarth, Kpler, Marinetraffic, OHB, Orbcomm, Saab, or any other maritime data vendor for that matter.

Discover how we deal with any location data.

Gain additional maritime insights using built-in analytical pages

Obtain new perspectives on your maritime location data. xyzt.ai’s dedicated pages enable you to analyze maritime trends, distributions, and movement pattern changes to answer questions, such as: How is your port performing? Where does traffic come from? How is the waiting time in anchorage zones affected? What global routes are taken by your competitors? What is the change in origins of travel?

Learn more about xyzt.ai’s top features.

Put your data in context by adding weather, ocean wave, ECDIS, or any background layer

Context is crucial to understand the big picture. Gain situational awareness by combining your maritime tracking data with other (temporal) data sources that help you understand and explain the situation. From NetCDF weather, ocean, climate data to aerial imagery to ECDIS charts, to ESRI maps. Combine multiple layers of data for a more enriched analysis. All within a common spatio-temporal view.

Discover actionable insights from aggregate heatmaps to individual vessel trajectories

Overview first, detail later. xyzt.ai’s analytical engine empowers you to analyze the big picture as well as micro movements. Analyze your maritime data by visualizing and comparing aggregate statistics, for example heatmaps, or zoom in to individual vessel trajectories. Analyze time series data and replay to understand every single movement.

Discover how xyzt.ai detects anomalous vessel movements at Port of Antwerp.

Build a dashboard, embed, and share your insights with the world

Data has many stories to tell. xyzt.ai enables you to build interactive dashboards with widgets displaying maps, timelines, dedicated pages, bar charts, and more. Using a special link, you can share your dashboard or any other analytical page on the xyzt.ai platform with your colleagues, stakeholders, clients, or whoever you like. You can even embed your insights as an interactive feature on your own platform or website.

Learn more about how to share your insights.

  • Customer case

    Detecting Anomalous Vessel Movements with AI at Port of Antwerp-Bruges

    Learn how the xyzt.ai platform is used to visually analyze detected anomalous vessel movements at Port of Antwerp-Bruges, the second largest seaport of Europe.
    Discover this use case
  • Customer case

    Recovering lost maritime trade taxes

    The xyzt.ai platform is used for maritime trade intelligence identifying vessels exporting (stolen) oil and evading taxes using tactics such as offshore ship-to-ship transfer. Based on AIS data and reports from the port authorities, in a couple months time, multiple millions of dollars of undeclared and hence lost taxes were identified using the xyzt.ai tool.
    Discover this use case
  • Customer case

    Levering aviation and maritime data for coverage analysis with Intelsat

    Intelsat operates the world's most trusted satellite telecom network. To ensure the best connectivity on board of cruise ships and international flights, Intelsat analyzes the flow of their customers' fleets with xyzt.ai.
    Discover this use case
  • Customer case

    Early warning collision avoidance system at INEOS Phenol at Port of Antwerp-Bruges

    The area around the INEOS phenol jetty in the Port of Antwerp, Belgium, is busy with a wide variety of vessel movements. A collision with the jetty potentially can have a severe impact on the site’s operations. In time warning of personnel and closing of the valves can prevent severe damage and multi-million EUR operational losses. An early warning collision avoidance system based on AIS and radar data, and the xyzt.ai anomaly detection software prevents such incidents.
    Discover this use case
  • Customer case

    Analyzing tug boat operations at Port of Antwerp-Bruges

    The Port of Antwerp-Bruges is one of Europe's busiest ports, with a significant number of vessel operations taking place daily. To ensure the safe and efficient mooring and unmooring of large ships, tug boats are employed, with various organizations responsible for overseeing their operations. Our team provided valuable assistance to the port by providing the tools to conduct an in-depth analysis of these operations, utilizing convoy tracking and advanced analytical techniques.
    Discover this use case
  • Customer case

    Maritime, aviation, and weather analytics with Spire

    Spire designs and operates their own constantly evolving satellite constellation and predictive models, giving access to earth data including maritime AIS data, aviation ADS-B data, and weather data. By partnering with xyzt.ai, Spire's customers can benefit from an easy, scalable tool that can handle and combine all these data sets for easy insight generation.
    Discover this use case

Why choose xyzt.ai?

With the xyzt.ai platform, the Maritime Data Analyst can finally handle multiple billions of records and still maintain interactive update rates. This means the analyst can look at vessel traffic over global regions as well as over multi-year time periods. In addition to querying, filtering, and visualizing the data, the platform provides advanced analytics capabilities such as analyzing and segmenting vessel traffics between multiple regions.

Your benefits? Instant analytics. Effortless insights.